| Zacks Company Profile for Bruker Corporation (BRKR : NSDQ) |
|
|
| |
| • Company Description |
| Bruker Corp designs & manufactures proprietary life science & materials research systems & associated products that serve multiple customers in life science research, pharmaceuticals, applied markets, nanotechnology, cell biology, clinical research, microbiology & in-vitro diagnostics. BSI Life Science reports under two groups: Bruker BioSpin Group & Bruker CALID Group. The Bruker BioSpin comprises the Bruker Magnetic Resonance & Preclinical Imaging divisions, which designs, manufactures & distributes enabling life science tools based on the magnetic resonance technology. The Bruker CALID comprises the Bruker Daltonics & primarily designs, manufactures & distributes life-science mass spectrometry instruments that can be integrated with other sample preparation or chromatography instruments. BSI Nano designs, manufactures & distributes advanced X-ray instruments to determine the characteristics of matter & the three-dimensional structure of molecules.
Number of Employees: 11,085 |
|
|
| |
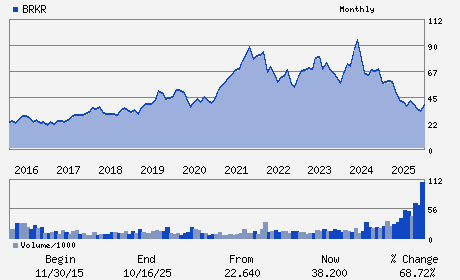
| • Price / Volume Information |
| Yesterday's Closing Price: $60.45 |
Daily Weekly Monthly
 |
| 20 Day Moving Average: 1,932,525 shares |
| Shares Outstanding: 152.23 (millions) |
| Market Capitalization: $9,202.06 (millions) |
| Beta: 1.29 |
| 52 Week High: $64.54 |
| 52 Week Low: $28.53 |
| Short Interest Ratio: |
| |
% Price Change |
% Price Change Relative to S&P 500 |
| 4 Week |
-0.72% |
-1.45% |
| 12 Week |
64.67% |
60.16% |
| Year To Date |
28.32% |
21.90% |
|
|
|
|
| |
|
|
| |
| • General Corporate Information |
Officers
Frank H. Laukien - President; Chief Executive Officer and Chairman
Gerald N. Herman - Executive Vice President and Chief Financial Offic
Thomas M. Bures - Chief Accounting Officer
Bonnie H. Anderson - Director
William A. Linton - Director
|
|
Peer Information
Bruker Corporation (DNEX)
Bruker Corporation (T.PUR)
Bruker Corporation (CALP.)
Bruker Corporation (CCSI.)
Bruker Corporation (NEWP.)
Bruker Corporation (PBSC.)
|
|
Industry / Sector / Ticker Info
Analyst Coverage: No
Industry Group: INSTRU-SCIENTFC
Sector: Computer and Technology
CUSIP: 116794108
SIC: 3826
|
|
Fiscal Year
Fiscal Year End: December
Last Reported Quarter: 03/01/26
Next Expected EPS Date: 08/03/26
|
|
Share - Related Items
Shares Outstanding: 152.23
Most Recent Split Date: (:1)
Beta: 1.29
Market Capitalization: $9,202.06 (millions)
|
|
|
|
|
| |
| • EPS Information |
• Dividend Information |
| Analyst Coverage: No |
Dividend Yield: 0.33% |
| Current Fiscal Quarter EPS Consensus Estimate: $0.55 |
Indicated Annual Dividend: $0.20 |
| Current Fiscal Year EPS Consensus Estimate: $2.12 |
Payout Ratio: 0.12 |
| Number of Estimates in the Fiscal Year Consensus: 4.00 |
Change In Payout Ratio: 0.03 |
| Estmated Long-Term EPS Growth Rate: 14.75% |
Last Dividend Paid: 06/22/2026 - $0.05 |
| Next EPS Report Date: 08/03/26 |
|
|
|
| |