| Zacks Company Profile for General Mills, Inc. (GIS : NYSE) |
|
|
| |
| • Company Description |
| General Mills Inc. is a global manufacturer and marketer of branded consumer foods sold through retail stores. The company also serves the foodservice and commercial baking industries. Its principal product categories include ready-to-eat cereals, convenient meals, snacks (including grain, fruit and savory snacks, nutrition bars, and frozen hot snacks), yogurt, super-premium ice creams as well as baking mixes and ingredients.
Number of Employees: 30,000 |
|
|
| |
| • Price / Volume Information |
| Yesterday's Closing Price: $36.03 |
Daily Weekly Monthly
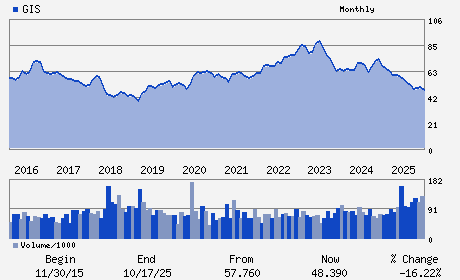 |
| 20 Day Moving Average: 10,958,694 shares |
| Shares Outstanding: 533.71 (millions) |
| Market Capitalization: $19,229.50 (millions) |
| Beta: -0.03 |
| 52 Week High: $51.33 |
| 52 Week Low: $31.75 |
| Short Interest Ratio: |
| |
% Price Change |
% Price Change Relative to S&P 500 |
| 4 Week |
1.78% |
1.03% |
| 12 Week |
2.04% |
-0.76% |
| Year To Date |
-22.52% |
-29.36% |
|
|
|
|
| |
|
|
| |
| • General Corporate Information |
Officers
Jeffrey L. Harmening - Chief Executive Officer; Chairman and Director
Dana M. McNabb - Chief Operating Officer
Kofi A. Bruce - Chief Financial Officer
Mark A. Pallot - Vice President; Chief Accounting Officer
Joan Bottarini - Director
|
|
Peer Information
General Mills, Inc. (CDSCY)
General Mills, Inc. (HDNHY)
General Mills, Inc. (CPB)
General Mills, Inc. (AMNF)
General Mills, Inc. (GMFIY)
General Mills, Inc. (BRID)
|
|
Industry / Sector / Ticker Info
Analyst Coverage: No
Industry Group: FOOD-MISC/DIVERSIFIED
Sector: Consumer Staples
CUSIP: 370334104
SIC: 2040
|
|
Fiscal Year
Fiscal Year End: May
Last Reported Quarter: 05/01/26
Next Expected EPS Date: 09/16/26
|
|
Share - Related Items
Shares Outstanding: 533.71
Most Recent Split Date: 6.00 (2.00:1)
Beta: -0.03
Market Capitalization: $19,229.50 (millions)
|
|
|
|
|
| |
| • EPS Information |
• Dividend Information |
| Analyst Coverage: No |
Dividend Yield: 6.77% |
| Current Fiscal Quarter EPS Consensus Estimate: $0.73 |
Indicated Annual Dividend: $2.44 |
| Current Fiscal Year EPS Consensus Estimate: $3.07 |
Payout Ratio: 0.69 |
| Number of Estimates in the Fiscal Year Consensus: 9.00 |
Change In Payout Ratio: 0.13 |
| Estmated Long-Term EPS Growth Rate: % |
Last Dividend Paid: 07/10/2026 - $0.61 |
| Next EPS Report Date: 09/16/26 |
|
|
|
| |

