| Zacks Company Profile for Johnson & Johnson (JNJ : NYSE) |
|
|
| |
| • Company Description |
| Johnson & Johnson's biggest strength is its diversified business model. It operates through pharmaceuticals, medical devices and consumer products divisions. Its diversification helps it to withstand economic cycles more effectively. J&J has one of the largest research and development (R&D) budget among pharma companies. J&J's worldwide business is divided into three segments: Pharmaceutical, Medical Devices and Consumer. The company has several drugs covering a broad range of areas such as neuroscience, cardiovascular & metabolism, immunology, oncology, pulmonary hypertension and infectious diseases and vaccines. The Medical Devices Segment offers products in the orthopedics, surgery, interventional solutions and vision markets. The Consumer Segment segment includes a broad range of products covering the areas of baby care, beauty/skin health, oral care, wound care and womens' health care, as well as over-the-counter (OTC) pharmaceutical products.
Number of Employees: 138,200 |
|
|
| |
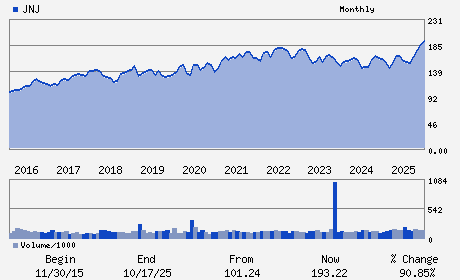
| • Price / Volume Information |
| Yesterday's Closing Price: $263.40 |
Daily Weekly Monthly
 |
| 20 Day Moving Average: 8,123,105 shares |
| Shares Outstanding: 2,407.22 (millions) |
| Market Capitalization: $634,060.94 (millions) |
| Beta: 0.24 |
| 52 Week High: $269.43 |
| 52 Week Low: $164.23 |
| Short Interest Ratio: |
| |
% Price Change |
% Price Change Relative to S&P 500 |
| 4 Week |
7.56% |
6.77% |
| 12 Week |
14.60% |
11.46% |
| Year To Date |
27.28% |
15.76% |
|
|
|
|
| |
|
|
| |
| • General Corporate Information |
Officers
J. Duato - Chief Executive Officer;Chairman of the Board
J. J. Wolk - Chief Financial Officer
R. J. Decker Jr. - Controller and Chief Accounting Officer
M. C. Beckerle - Director
J. A. Doudna - Director
|
|
Peer Information
Johnson & Johnson (AGN.)
Johnson & Johnson (NVS)
Johnson & Johnson (NVO)
Johnson & Johnson (LLY)
Johnson & Johnson (RHHBY)
Johnson & Johnson (JNJ)
|
|
Industry / Sector / Ticker Info
Analyst Coverage: No
Industry Group: Large Cap Pharma
Sector: Medical
CUSIP: 478160104
SIC: 2834
|
|
Fiscal Year
Fiscal Year End: December
Last Reported Quarter: 06/01/26
Next Expected EPS Date: 10/13/26
|
|
Share - Related Items
Shares Outstanding: 2,407.22
Most Recent Split Date: 6.00 (2.00:1)
Beta: 0.24
Market Capitalization: $634,060.94 (millions)
|
|
|
|
|
| |
| • EPS Information |
• Dividend Information |
| Analyst Coverage: No |
Dividend Yield: 2.03% |
| Current Fiscal Quarter EPS Consensus Estimate: $3.04 |
Indicated Annual Dividend: $5.36 |
| Current Fiscal Year EPS Consensus Estimate: $11.68 |
Payout Ratio: 0.49 |
| Number of Estimates in the Fiscal Year Consensus: 8.00 |
Change In Payout Ratio: 0.03 |
| Estmated Long-Term EPS Growth Rate: 9.02% |
Last Dividend Paid: 05/26/2026 - $1.34 |
| Next EPS Report Date: 10/13/26 |
|
|
|
| |