| Zacks Company Profile for Marriott International, Inc. (MAR : NSDQ) |
|
|
| |
| • Company Description |
| Marriott International Inc. is a worldwide operator, franchisor, and licensor of hotel, residential, and timeshare properties under numerous brand names at different price and service points. They have two operating segments: U.S. & Canada and International. Marriott operates and franchises hotels and licenses vacation ownership resorts all around the world.
Number of Employees: 414,000 |
|
|
| |
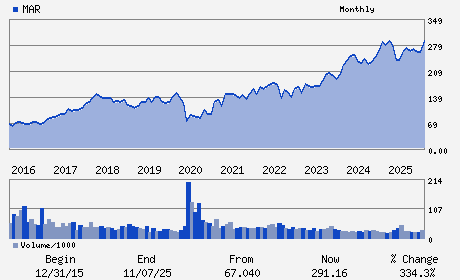
| • Price / Volume Information |
| Yesterday's Closing Price: $374.43 |
Daily Weekly Monthly
 |
| 20 Day Moving Average: 1,322,514 shares |
| Shares Outstanding: 263.69 (millions) |
| Market Capitalization: $98,732.93 (millions) |
| Beta: 1.11 |
| 52 Week High: $410.98 |
| 52 Week Low: $253.76 |
| Short Interest Ratio: |
| |
% Price Change |
% Price Change Relative to S&P 500 |
| 4 Week |
-0.76% |
-1.54% |
| 12 Week |
5.48% |
2.89% |
| Year To Date |
20.69% |
11.47% |
|
|
|
|
| |
|
|
| |
| • General Corporate Information |
Officers
Anthony G. Capuano - President; Chief Executive Officer and Director
David S. Marriott - Chairman of the Board
Kathleen K. Oberg - Chief Financial Officer and Executive Vice Preside
Aylwin B. Lewis - Director
Isabella D. Goren - Director
|
|
Peer Information
Marriott International, Inc. (HOT.)
Marriott International, Inc. (CHH)
Marriott International, Inc. (ESA.)
Marriott International, Inc. (GPSRY)
Marriott International, Inc. (FS)
Marriott International, Inc. (CLMDY)
|
|
Industry / Sector / Ticker Info
Analyst Coverage: No
Industry Group: HOTELS & MOTELS
Sector: Consumer Discretionary
CUSIP: 571903202
SIC: 7011
|
|
Fiscal Year
Fiscal Year End: December
Last Reported Quarter: 03/01/26
Next Expected EPS Date: 08/03/26
|
|
Share - Related Items
Shares Outstanding: 263.69
Most Recent Split Date: 11.00 (1.00:1)
Beta: 1.11
Market Capitalization: $98,732.93 (millions)
|
|
|
|
|
| |
| • EPS Information |
• Dividend Information |
| Analyst Coverage: No |
Dividend Yield: 0.78% |
| Current Fiscal Quarter EPS Consensus Estimate: $2.93 |
Indicated Annual Dividend: $2.92 |
| Current Fiscal Year EPS Consensus Estimate: $11.66 |
Payout Ratio: 0.26 |
| Number of Estimates in the Fiscal Year Consensus: 10.00 |
Change In Payout Ratio: 0.06 |
| Estmated Long-Term EPS Growth Rate: 10.95% |
Last Dividend Paid: 05/22/2026 - $0.73 |
| Next EPS Report Date: 08/03/26 |
|
|
|
| |