| Zacks Company Profile for Prologis, Inc. (PLD : NYSE) |
|
|
| |
| • Company Description |
| Prologis, Inc. is the global leader in logistics real estate with a focus on high-barrier, high-growth markets. Prologis leases modern logistics facilities to a diverse base of customers principally across two major categories: business-to-business and retail/online fulfillment.
Number of Employees: 2,802 |
|
|
| |
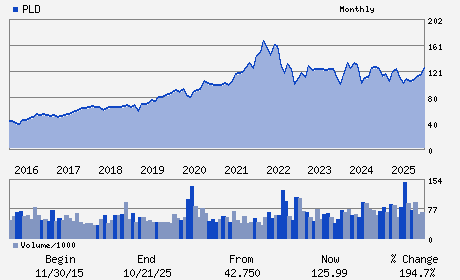
| • Price / Volume Information |
| Yesterday's Closing Price: $147.63 |
Daily Weekly Monthly
 |
| 20 Day Moving Average: 4,036,553 shares |
| Shares Outstanding: 932.34 (millions) |
| Market Capitalization: $137,641.06 (millions) |
| Beta: 1.32 |
| 52 Week High: $153.35 |
| 52 Week Low: $103.41 |
| Short Interest Ratio: |
| |
% Price Change |
% Price Change Relative to S&P 500 |
| 4 Week |
5.05% |
4.28% |
| 12 Week |
3.95% |
1.10% |
| Year To Date |
15.64% |
5.04% |
|
|
|
|
| |
|
|
| |
| • General Corporate Information |
Officers
Daniel S. Letter - Chief Executive Officer and Director
Hamid R. Moghadam - Executive Chairman
Timothy D. Arndt - Chief Financial Officer
Lori A. Palazzolo - Managing Director and Chief Accounting Officer
Cristina G. Bita - Director
|
|
Peer Information
Prologis, Inc. (ARE)
Prologis, Inc. (CUZ)
Prologis, Inc. (FUR)
Prologis, Inc. (NNN)
Prologis, Inc. (FCH)
Prologis, Inc. (CTO)
|
|
Industry / Sector / Ticker Info
Analyst Coverage: No
Industry Group: REIT-EQTY TRUST -OTHER
Sector: Finance
CUSIP: 74340W103
SIC: 6798
|
|
Fiscal Year
Fiscal Year End: December
Last Reported Quarter: 06/01/26
Next Expected EPS Date: 10/21/26
|
|
Share - Related Items
Shares Outstanding: 932.34
Most Recent Split Date: (:1)
Beta: 1.32
Market Capitalization: $137,641.06 (millions)
|
|
|
|
|
| |
| • EPS Information |
• Dividend Information |
| Analyst Coverage: No |
Dividend Yield: 2.90% |
| Current Fiscal Quarter EPS Consensus Estimate: $1.58 |
Indicated Annual Dividend: $4.28 |
| Current Fiscal Year EPS Consensus Estimate: $6.28 |
Payout Ratio: 0.71 |
| Number of Estimates in the Fiscal Year Consensus: 4.00 |
Change In Payout Ratio: 0.03 |
| Estmated Long-Term EPS Growth Rate: % |
Last Dividend Paid: 06/16/2026 - $1.07 |
| Next EPS Report Date: 10/21/26 |
|
|
|
| |