| Zacks Company Profile for Prudential Financial, Inc. (PRU : NYSE) |
|
|
| |
| • Company Description |
| Prudential Financial Inc., through its subsidiaries and affiliates, is a financial services leader offers an array of financial products and services including life insurance, annuities, retirement-related services, mutual funds, investment management and real estate services. These are offered to individual and institutional customers across United States, Asia, Europe and Latin America.
Number of Employees: 36,824 |
|
|
| |
| • Price / Volume Information |
| Yesterday's Closing Price: $119.96 |
Daily Weekly Monthly
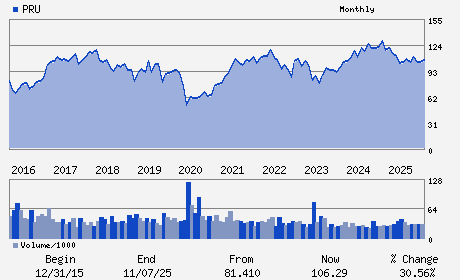 |
| 20 Day Moving Average: 1,627,815 shares |
| Shares Outstanding: 347.00 (millions) |
| Market Capitalization: $41,626.12 (millions) |
| Beta: 0.85 |
| 52 Week High: $120.59 |
| 52 Week Low: $91.89 |
| Short Interest Ratio: |
| |
% Price Change |
% Price Change Relative to S&P 500 |
| 4 Week |
12.08% |
11.26% |
| 12 Week |
22.27% |
18.92% |
| Year To Date |
6.27% |
-3.54% |
|
|
|
|
| |
|
|
| |
| • General Corporate Information |
Officers
Andrew F. Sullivan - Chief Executive Officer; President and Director
Charles F. Lowrey - Chairman and Director
Yanela C. Frias - Chief Financial Officer and Executive Vice Preside
Robert E. Boyle - Senior Vice President and Controller
Gilbert F. Casellas - Director
|
|
Peer Information
Prudential Financial, Inc. (RDN)
Prudential Financial, Inc. (AIG)
Prudential Financial, Inc. (ACGI)
Prudential Financial, Inc. (TXSC)
Prudential Financial, Inc. (PTVCB)
Prudential Financial, Inc. (PTVCA)
|
|
Industry / Sector / Ticker Info
Analyst Coverage: No
Industry Group: INS-MULTI LINE
Sector: Finance
CUSIP: 744320102
SIC: 6311
|
|
Fiscal Year
Fiscal Year End: December
Last Reported Quarter: 03/01/26
Next Expected EPS Date: 08/04/26
|
|
Share - Related Items
Shares Outstanding: 347.00
Most Recent Split Date: (:1)
Beta: 0.85
Market Capitalization: $41,626.12 (millions)
|
|
|
|
|
| |
| • EPS Information |
• Dividend Information |
| Analyst Coverage: No |
Dividend Yield: 4.67% |
| Current Fiscal Quarter EPS Consensus Estimate: $3.39 |
Indicated Annual Dividend: $5.60 |
| Current Fiscal Year EPS Consensus Estimate: $13.75 |
Payout Ratio: 0.38 |
| Number of Estimates in the Fiscal Year Consensus: 10.00 |
Change In Payout Ratio: -0.03 |
| Estmated Long-Term EPS Growth Rate: 3.64% |
Last Dividend Paid: 05/26/2026 - $1.40 |
| Next EPS Report Date: 08/04/26 |
|
|
|
| |

