| Zacks Company Profile for Quad Graphics, Inc (QUAD : NYSE) |
|
|
| |
| • Company Description |
| Quad/Graphics, Inc. provide marketing solution. The company offer a comprehensive range of marketing and print services which seamlessly integrate creative, production and media solutions across online and offline channels. Quad/Graphics, Inc. is based in SUSSEX, Wis.
Number of Employees: 10,100 |
|
|
| |
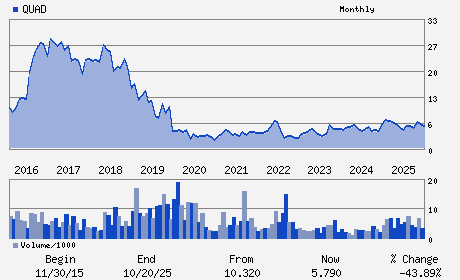
| • Price / Volume Information |
| Yesterday's Closing Price: $8.34 |
Daily Weekly Monthly
 |
| 20 Day Moving Average: 126,312 shares |
| Shares Outstanding: 51.56 (millions) |
| Market Capitalization: $430.01 (millions) |
| Beta: 1.11 |
| 52 Week High: $8.84 |
| 52 Week Low: $5.01 |
| Short Interest Ratio: |
| |
% Price Change |
% Price Change Relative to S&P 500 |
| 4 Week |
-1.18% |
-1.96% |
| 12 Week |
-1.07% |
-3.49% |
| Year To Date |
33.01% |
22.85% |
|
|
|
|
| |
| • Address & Contact Information |
| Street Address |
Phone / Fax |
Email Address |
Web URL |
N61 W23044 HARRY`S WAY
-
SUSSEX,WI 53089
USA |
ph: 414-566-6000
fax: 414-566-4650 |
ir@quad.com |
http://www.quad.com |
|
|
| |
| • General Corporate Information |
Officers
J. Joel Quadracci - Chairman and Chief Executive Officer
David J. Honan - President and Chief Operating Officer
Anthony C. Staniak - Chief Financial Officer and Treasurer
Julie A. Currie - Executive Vice President and Chief Revenue Officer
Kelly A. Vanderboom - Executive Vice President and Head of Agency Operat
|
|
Peer Information
Quad Graphics, Inc (IBDI)
Quad Graphics, Inc (VAPR)
Quad Graphics, Inc (SWWI)
Quad Graphics, Inc (GREY)
Quad Graphics, Inc (JCDXF)
Quad Graphics, Inc (GMIG)
|
|
Industry / Sector / Ticker Info
Analyst Coverage: No
Industry Group: ADVERTISING/MKTG SVCS
Sector: Business Services
CUSIP: 747301109
SIC: 2750
|
|
Fiscal Year
Fiscal Year End: December
Last Reported Quarter: 03/01/26
Next Expected EPS Date: 07/28/26
|
|
Share - Related Items
Shares Outstanding: 51.56
Most Recent Split Date: (:1)
Beta: 1.11
Market Capitalization: $430.01 (millions)
|
|
|
|
|
| |
| • EPS Information |
• Dividend Information |
| Analyst Coverage: No |
Dividend Yield: 4.80% |
| Current Fiscal Quarter EPS Consensus Estimate: $0.34 |
Indicated Annual Dividend: $0.40 |
| Current Fiscal Year EPS Consensus Estimate: $1.20 |
Payout Ratio: 0.38 |
| Number of Estimates in the Fiscal Year Consensus: 1.00 |
Change In Payout Ratio: 0.23 |
| Estmated Long-Term EPS Growth Rate: % |
Last Dividend Paid: 05/21/2026 - $0.10 |
| Next EPS Report Date: 07/28/26 |
|
|
|
| |