| Zacks Company Profile for AIA (AAGIY : OTC) |
|
|
| |
| • Company Description |
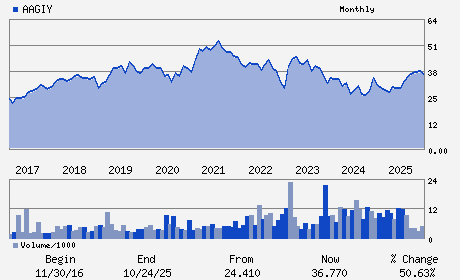
| AIA Group Ltd. is a life insurance company. It operates primarily in Hong Kong, Thailand, Singapore, Malaysia, China, Korea, the Philippines, Australia, Indonesia, Taiwan, Vietnam, New Zealand, Macau, Brunei, Sri Lanka, India, Myanmar and Cambodia. AIA Group Ltd. is based in Central, Hong Kong.
Number of Employees: 25,938 |
|
|
| |
| • Price / Volume Information |
| Yesterday's Closing Price: $43.25 |
Daily Weekly Monthly
 |
| 20 Day Moving Average: 410,658 shares |
| Shares Outstanding: 2,627.06 (millions) |
| Market Capitalization: $113,620.19 (millions) |
| Beta: 0.25 |
| 52 Week High: $46.84 |
| 52 Week Low: $25.01 |
| Short Interest Ratio: |
| |
% Price Change |
% Price Change Relative to S&P 500 |
| 4 Week |
-0.85% |
4.20% |
| 12 Week |
2.51% |
7.83% |
| Year To Date |
5.41% |
10.06% |
|
|
|
|
| |
| • Address & Contact Information |
| Street Address |
Phone / Fax |
Email Address |
Web URL |
AIA Central 35th Floor No. 1 Connaught Road
-
Hong Kong,K3 00000
HKG |
ph: 852-2832-6166
fax: 852-2838-2005 |
ir@aia.com |
http://www.aia.com |
|
|
| |
| • General Corporate Information |
Officers
Lee Yuan Siong - Chief Executive Officer; President and Director
Edmund Sze-Wing Tse - Chairman
Jack Chak-Kwong So - Director
Chung-Kong Chow - Director
ohn Barrie Harrison - Director
|
|
Peer Information
AIA (AGC.)
AIA (T.GWO)
AIA (AMH.2)
AIA (CSLI.)
AIA (CIA)
AIA (DFG)
|
|
Industry / Sector / Ticker Info
Analyst Coverage: No
Industry Group: INS-LIFE
Sector: Finance
CUSIP: 001317205
SIC: 6311
|
|
Fiscal Year
Fiscal Year End: December
Last Reported Quarter: -
Next Expected EPS Date: -
|
|
Share - Related Items
Shares Outstanding: 2,627.06
Most Recent Split Date: (:1)
Beta: 0.25
Market Capitalization: $113,620.19 (millions)
|
|
|
|
|
| |
| • EPS Information |
• Dividend Information |
| Analyst Coverage: No |
Dividend Yield: 1.02% |
| Current Fiscal Quarter EPS Consensus Estimate: $ |
Indicated Annual Dividend: $0.44 |
| Current Fiscal Year EPS Consensus Estimate: $3.18 |
Payout Ratio: |
| Number of Estimates in the Fiscal Year Consensus: 2.00 |
Change In Payout Ratio: |
| Estmated Long-Term EPS Growth Rate: % |
Last Dividend Paid: NA - $0.00 |
| Next EPS Report Date: - |
|
|
|
| |