| Zacks Company Profile for Applied Optoelectronics, Inc. (AAOI : NSDQ) |
|
|
| |
| • Company Description |
| Applied Optoelectronics, Inc. designs, develops and manufactures advanced optical devices, packaged optical components, optical subsystems, laser transmitters and fiber optic transceivers. The company's products are used in fiber optic communications equipment for FTTH, point-to-point telecom, datacom and access networks and systems supporting cable television, network infrastructure. Applied Optoelectronics, Inc. is headquartered in Sugar Land, Texas.
Number of Employees: 4,691 |
|
|
| |
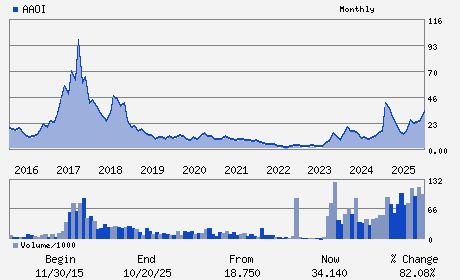
| • Price / Volume Information |
| Yesterday's Closing Price: $87.54 |
Daily Weekly Monthly
 |
| 20 Day Moving Average: 12,946,560 shares |
| Shares Outstanding: 75.20 (millions) |
| Market Capitalization: $6,582.90 (millions) |
| Beta: 3.19 |
| 52 Week High: $128.96 |
| 52 Week Low: $9.71 |
| Short Interest Ratio: |
| |
% Price Change |
% Price Change Relative to S&P 500 |
| 4 Week |
69.39% |
79.88% |
| 12 Week |
135.51% |
150.84% |
| Year To Date |
151.12% |
164.20% |
|
|
|
|
| |
| • Address & Contact Information |
| Street Address |
Phone / Fax |
Email Address |
Web URL |
13139 JESS PIRTLE BLVD
-
SUGAR LAND,TX 77478
USA |
ph: 281-295-1800
fax: - |
ir@ao-inc.com |
http://www.ao-inc.com |
|
|
| |
| • General Corporate Information |
Officers
Chih-Hsiang (Thompson) Lin - Chief Executive Officer; Chairman of the Board and
Stefan J. Murry - Chief Financial Officer
William H. Yeh - Director
Richard B. Black - Director
Che-Wei lin - Director
|
|
Peer Information
Applied Optoelectronics, Inc. (CPCL.)
Applied Optoelectronics, Inc. (HIFN)
Applied Optoelectronics, Inc. (SEM.1)
Applied Optoelectronics, Inc. (DION)
Applied Optoelectronics, Inc. (AMKR)
Applied Optoelectronics, Inc. (CNXT.)
|
|
Industry / Sector / Ticker Info
Analyst Coverage: No
Industry Group: ELEC COMP-SEMIC
Sector: Computer and Technology
CUSIP: 03823U102
SIC: 3674
|
|
Fiscal Year
Fiscal Year End: December
Last Reported Quarter: 12/01/25
Next Expected EPS Date: 05/14/26
|
|
Share - Related Items
Shares Outstanding: 75.20
Most Recent Split Date: (:1)
Beta: 3.19
Market Capitalization: $6,582.90 (millions)
|
|
|
|
|
| |
| • EPS Information |
• Dividend Information |
| Analyst Coverage: No |
Dividend Yield: 0.00% |
| Current Fiscal Quarter EPS Consensus Estimate: $-0.10 |
Indicated Annual Dividend: $0.00 |
| Current Fiscal Year EPS Consensus Estimate: $0.66 |
Payout Ratio: |
| Number of Estimates in the Fiscal Year Consensus: 3.00 |
Change In Payout Ratio: |
| Estmated Long-Term EPS Growth Rate: % |
Last Dividend Paid: NA - $0.00 |
| Next EPS Report Date: 05/14/26 |
|
|
|
| |