| Zacks Company Profile for Alamo Group, Inc. (ALG : NYSE) |
|
|
| |
| • Company Description |
| Alamo Group is a leader in the design, manufacture, distribution and service of high quality equipment for infrastructure maintenance, agriculture and other applications. Their products include truck and tractor mounted mowing and other vegetation maintenance equipment, street sweepers, snow removal equipment, excavators, vacuum trucks, other industrial equipment, agricultural implements and related after-market parts and services.
Number of Employees: 3,800 |
|
|
| |
| • Price / Volume Information |
| Yesterday's Closing Price: $168.20 |
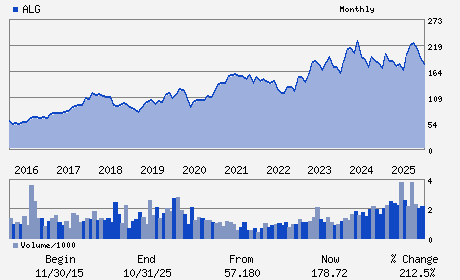
Daily Weekly Monthly
 |
| 20 Day Moving Average: 173,650 shares |
| Shares Outstanding: 12.12 (millions) |
| Market Capitalization: $2,038.80 (millions) |
| Beta: 1.20 |
| 52 Week High: $233.29 |
| 52 Week Low: $156.30 |
| Short Interest Ratio: |
| |
% Price Change |
% Price Change Relative to S&P 500 |
| 4 Week |
-2.85% |
0.81% |
| 12 Week |
-9.82% |
-5.18% |
| Year To Date |
0.20% |
4.20% |
|
|
|
|
| |
| • Address & Contact Information |
| Street Address |
Phone / Fax |
Email Address |
Web URL |
1627 EAST WALNUT
-
SEGUIN,TX 78155
USA |
ph: 830-379-1480
fax: 830-372-9683 |
None |
http://www.alamo-group.com |
|
|
| |
| • General Corporate Information |
Officers
Robert P. Hureau - President & Chief Executive Officer
Richard W. Parod - Independent Board Chair & Director
Agnieszka K. Kamps - Executive Vice President & Chief Financial Officer
Robert P. Bauer - Director
Eric P. Etchart - Director
|
|
Peer Information
Alamo Group, Inc. (BGGSQ)
Alamo Group, Inc. (INQD)
Alamo Group, Inc. (T.FTT)
Alamo Group, Inc. (ALG)
Alamo Group, Inc. (CTBC2)
Alamo Group, Inc. (LNN)
|
|
Industry / Sector / Ticker Info
Analyst Coverage: No
Industry Group: MACH-FARM
Sector: Industrial Products
CUSIP: 011311107
SIC: 3523
|
|
Fiscal Year
Fiscal Year End: December
Last Reported Quarter: 12/01/25
Next Expected EPS Date: 05/14/26
|
|
Share - Related Items
Shares Outstanding: 12.12
Most Recent Split Date: (:1)
Beta: 1.20
Market Capitalization: $2,038.80 (millions)
|
|
|
|
|
| |
| • EPS Information |
• Dividend Information |
| Analyst Coverage: No |
Dividend Yield: 0.81% |
| Current Fiscal Quarter EPS Consensus Estimate: $2.73 |
Indicated Annual Dividend: $1.36 |
| Current Fiscal Year EPS Consensus Estimate: $10.32 |
Payout Ratio: 0.13 |
| Number of Estimates in the Fiscal Year Consensus: 4.00 |
Change In Payout Ratio: 0.03 |
| Estmated Long-Term EPS Growth Rate: 16.00% |
Last Dividend Paid: 01/16/2026 - $0.34 |
| Next EPS Report Date: 05/14/26 |
|
|
|
| |