| Zacks Company Profile for Alarm.com Holdings, Inc. (ALRM : NSDQ) |
|
|
| |
| • Company Description |
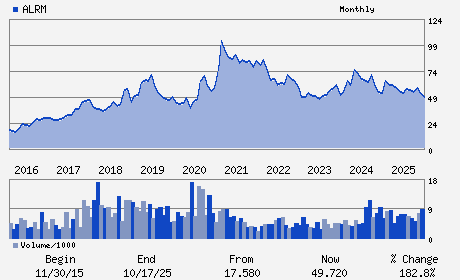
| Alarm.com Holdings, Inc. offers interactive security solutions for home and business owners. The Company offers security systems which include image sensor, crash and smash protection, web control, mobile access and video monitoring. Alarm.com Holdings, Inc. is based in VIENNA, United States.
Number of Employees: 2,058 |
|
|
| |
| • Price / Volume Information |
| Yesterday's Closing Price: $46.06 |
Daily Weekly Monthly
 |
| 20 Day Moving Average: 523,371 shares |
| Shares Outstanding: 49.67 (millions) |
| Market Capitalization: $2,287.62 (millions) |
| Beta: 0.80 |
| 52 Week High: $60.76 |
| 52 Week Low: $43.00 |
| Short Interest Ratio: |
| |
% Price Change |
% Price Change Relative to S&P 500 |
| 4 Week |
1.88% |
5.83% |
| 12 Week |
-11.18% |
-7.06% |
| Year To Date |
-9.72% |
-6.71% |
|
|
|
|
| |
| • Address & Contact Information |
| Street Address |
Phone / Fax |
Email Address |
Web URL |
8281 GREENSBORO DRIVE SUITE 100
-
TYSONS,VA 22102
USA |
ph: 877-389-4033
fax: - |
ir@alarm.com |
http://www.alarm.com |
|
|
| |
| • General Corporate Information |
Officers
Stephen Trundle - Chief Executive Officer
Timothy McAdam - Chairman of the Board of Directors
Kevin Bradley - Chief Financial Officer
Donald Clarke - Director
Cecile Harper - Director
|
|
Peer Information
Alarm.com Holdings, Inc. (BRC)
Alarm.com Holdings, Inc. (ALGI)
Alarm.com Holdings, Inc. (SYNX.)
Alarm.com Holdings, Inc. (ADSV)
Alarm.com Holdings, Inc. (CDCY)
Alarm.com Holdings, Inc. (CSCQ)
|
|
Industry / Sector / Ticker Info
Analyst Coverage: No
Industry Group: PROTECTION-SFTY
Sector: Industrial Products
CUSIP: 011642105
SIC: 7372
|
|
Fiscal Year
Fiscal Year End: December
Last Reported Quarter: 12/01/25
Next Expected EPS Date: 05/14/26
|
|
Share - Related Items
Shares Outstanding: 49.67
Most Recent Split Date: (:1)
Beta: 0.80
Market Capitalization: $2,287.62 (millions)
|
|
|
|
|
| |
| • EPS Information |
• Dividend Information |
| Analyst Coverage: No |
Dividend Yield: 0.00% |
| Current Fiscal Quarter EPS Consensus Estimate: $0.48 |
Indicated Annual Dividend: $0.00 |
| Current Fiscal Year EPS Consensus Estimate: $2.24 |
Payout Ratio: 0.00 |
| Number of Estimates in the Fiscal Year Consensus: 3.00 |
Change In Payout Ratio: 0.00 |
| Estmated Long-Term EPS Growth Rate: 12.75% |
Last Dividend Paid: NA - $0.00 |
| Next EPS Report Date: 05/14/26 |
|
|
|
| |