| Zacks Company Profile for AMC Entertainment Holdings, Inc. (AMC : NYSE) |
|
|
| |
| • Company Description |
| AMC Entertainment Holdings, Inc., operates as a theatrical exhibition company primarily in the United States and internationally. It owned or interests in theatres and screens. AMC Entertainment Holdings, Inc. is based in Leawood, Kansas.
Number of Employees: 33,311 |
|
|
| |
| • Price / Volume Information |
| Yesterday's Closing Price: $1.02 |
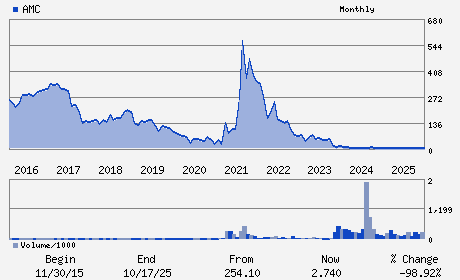
Daily Weekly Monthly
 |
| 20 Day Moving Average: 27,149,066 shares |
| Shares Outstanding: 529.55 (millions) |
| Market Capitalization: $540.14 (millions) |
| Beta: 1.85 |
| 52 Week High: $4.08 |
| 52 Week Low: $1.00 |
| Short Interest Ratio: |
| |
% Price Change |
% Price Change Relative to S&P 500 |
| 4 Week |
-17.74% |
-14.56% |
| 12 Week |
-39.29% |
-36.47% |
| Year To Date |
-34.62% |
-32.44% |
|
|
|
|
| |
|
|
| |
| • General Corporate Information |
Officers
Adam M. Aron - Chairman; Chief Executive Officer and President
Sean D. Goodman - Executive Vice President; Chief Financial Officer
Chris A. Cox - Senior Vice President
Anthony J. Saich - Director
Denise Clark - Director
|
|
Peer Information
AMC Entertainment Holdings, Inc. (KJFI)
AMC Entertainment Holdings, Inc. (MBEW)
AMC Entertainment Holdings, Inc. (DVD)
AMC Entertainment Holdings, Inc. (GCCXQ)
AMC Entertainment Holdings, Inc. (AMIEQ)
AMC Entertainment Holdings, Inc. (FAIR)
|
|
Industry / Sector / Ticker Info
Analyst Coverage: No
Industry Group: LEISURE&REC SVS
Sector: Consumer Discretionary
CUSIP: 00165C302
SIC: 7830
|
|
Fiscal Year
Fiscal Year End: December
Last Reported Quarter: 12/01/25
Next Expected EPS Date: 05/06/26
|
|
Share - Related Items
Shares Outstanding: 529.55
Most Recent Split Date: 8.00 (0.10:1)
Beta: 1.85
Market Capitalization: $540.14 (millions)
|
|
|
|
|
| |
| • EPS Information |
• Dividend Information |
| Analyst Coverage: No |
Dividend Yield: 0.00% |
| Current Fiscal Quarter EPS Consensus Estimate: $-0.36 |
Indicated Annual Dividend: $0.00 |
| Current Fiscal Year EPS Consensus Estimate: $-0.42 |
Payout Ratio: |
| Number of Estimates in the Fiscal Year Consensus: 4.00 |
Change In Payout Ratio: |
| Estmated Long-Term EPS Growth Rate: % |
Last Dividend Paid: NA - $0.00 |
| Next EPS Report Date: 05/06/26 |
|
|
|
| |