| Zacks Company Profile for Advanced Micro Devices, Inc. (AMD : NSDQ) |
|
|
| |
| • Company Description |
| Advanced Micro Devices offers the industry?s broadest portfolio of leadership high-performance and adaptive processor technologies, combining CPUs, GPUs, FPGAs, Adaptive SoCs and deep software expertise to enable leadership computing platforms for cloud, edge and end devices.
Number of Employees: 31,000 |
|
|
| |
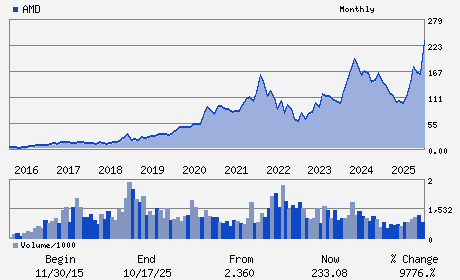
| • Price / Volume Information |
| Yesterday's Closing Price: $200.21 |
Daily Weekly Monthly
 |
| 20 Day Moving Average: 41,055,900 shares |
| Shares Outstanding: 1,630.41 (millions) |
| Market Capitalization: $326,424.56 (millions) |
| Beta: 1.98 |
| 52 Week High: $267.08 |
| 52 Week Low: $76.48 |
| Short Interest Ratio: |
| |
% Price Change |
% Price Change Relative to S&P 500 |
| 4 Week |
-15.43% |
-14.69% |
| 12 Week |
-8.15% |
-8.26% |
| Year To Date |
-6.51% |
-6.97% |
|
|
|
|
| |
|
|
| |
| • General Corporate Information |
Officers
Lisa T. Su - President and Chief Executive Officer
Jean Hu - Executive Vice President; Chief Financial Officer
Emily Ellis - Corporate Vice President; Chief Accounting Officer
KC McClure - Director
Jon A. Olson - Director
|
|
Peer Information
Advanced Micro Devices, Inc. (AFFI)
Advanced Micro Devices, Inc. (NQLIQ)
Advanced Micro Devices, Inc. (CSPI)
Advanced Micro Devices, Inc. (M.NXS)
Advanced Micro Devices, Inc. (GTLL)
Advanced Micro Devices, Inc. (FARO)
|
|
Industry / Sector / Ticker Info
Analyst Coverage: No
Industry Group: COMP-INTEGT SYS
Sector: Computer and Technology
CUSIP: 007903107
SIC: 3674
|
|
Fiscal Year
Fiscal Year End: December
Last Reported Quarter: 12/01/25
Next Expected EPS Date: 05/05/26
|
|
Share - Related Items
Shares Outstanding: 1,630.41
Most Recent Split Date: 8.00 (2.00:1)
Beta: 1.98
Market Capitalization: $326,424.56 (millions)
|
|
|
|
|
| |
| • EPS Information |
• Dividend Information |
| Analyst Coverage: No |
Dividend Yield: 0.00% |
| Current Fiscal Quarter EPS Consensus Estimate: $1.03 |
Indicated Annual Dividend: $0.00 |
| Current Fiscal Year EPS Consensus Estimate: $5.62 |
Payout Ratio: 0.00 |
| Number of Estimates in the Fiscal Year Consensus: 19.00 |
Change In Payout Ratio: 0.00 |
| Estmated Long-Term EPS Growth Rate: 47.10% |
Last Dividend Paid: NA - $0.00 |
| Next EPS Report Date: 05/05/26 |
|
|
|
| |