| Zacks Company Profile for Academy Sports and Outdoors, Inc. (ASO : NSDQ) |
|
|
| |
| • Company Description |
| Academy Sports and Outdoors Inc. provides sporting goods and outdoor recreation retailers principally in the United States. The company's product assortment focuses on outdoor, apparel, footwear and sports & recreation. Academy Sports and Outdoors Inc. is based in KATY, Texas.
Number of Employees: 23,000 |
|
|
| |
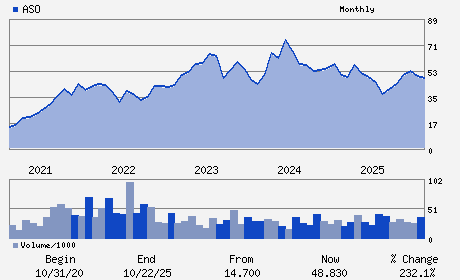
| • Price / Volume Information |
| Yesterday's Closing Price: $52.66 |
Daily Weekly Monthly
 |
| 20 Day Moving Average: 1,790,991 shares |
| Shares Outstanding: 64.38 (millions) |
| Market Capitalization: $3,390.43 (millions) |
| Beta: 1.23 |
| 52 Week High: $62.45 |
| 52 Week Low: $33.34 |
| Short Interest Ratio: |
| |
% Price Change |
% Price Change Relative to S&P 500 |
| 4 Week |
-10.58% |
-7.09% |
| 12 Week |
5.07% |
10.25% |
| Year To Date |
5.40% |
9.64% |
|
|
|
|
| |
|
|
| |
| • General Corporate Information |
Officers
Steven Lawrence - Chief Executive Officer and Director
Ken C. Hicks - Chairman of the Board
Samuel J. Johnson - President
Earl Carlton Ford - Executive Vice President and Chief Financial Offic
Wendy A. Beck - Director
|
|
Peer Information
Academy Sports and Outdoors, Inc. (BAJAY)
Academy Sports and Outdoors, Inc. (ESCA)
Academy Sports and Outdoors, Inc. (GOYL)
Academy Sports and Outdoors, Inc. (FTSP)
Academy Sports and Outdoors, Inc. (KTO)
Academy Sports and Outdoors, Inc. (BOLL)
|
|
Industry / Sector / Ticker Info
Analyst Coverage: No
Industry Group: LEISURE&REC PRD
Sector: Consumer Discretionary
CUSIP: 00402L107
SIC: 5940
|
|
Fiscal Year
Fiscal Year End: January
Last Reported Quarter: 01/01/26
Next Expected EPS Date: 06/09/26
|
|
Share - Related Items
Shares Outstanding: 64.38
Most Recent Split Date: (:1)
Beta: 1.23
Market Capitalization: $3,390.43 (millions)
|
|
|
|
|
| |
| • EPS Information |
• Dividend Information |
| Analyst Coverage: No |
Dividend Yield: 1.14% |
| Current Fiscal Quarter EPS Consensus Estimate: $0.88 |
Indicated Annual Dividend: $0.60 |
| Current Fiscal Year EPS Consensus Estimate: $5.93 |
Payout Ratio: 0.09 |
| Number of Estimates in the Fiscal Year Consensus: 5.00 |
Change In Payout Ratio: 0.04 |
| Estmated Long-Term EPS Growth Rate: 10.85% |
Last Dividend Paid: 03/20/2026 - $0.15 |
| Next EPS Report Date: 06/09/26 |
|
|
|
| |