| Zacks Company Profile for Acuity, Inc. (AYI : NYSE) |
|
|
| |
| • Company Description |
| Acuity Inc. is an industrial technology company. Its business segments include Acuity Brands Lighting and Acuity Intelligent Spaces which design, manufacture and bring to market products and services. Acuity Inc., formerly known as ACUITY BRANDS, is based in Atlanta.
Number of Employees: 13,800 |
|
|
| |
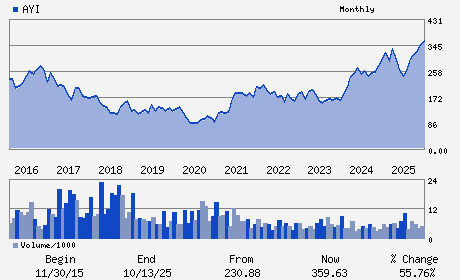
| • Price / Volume Information |
| Yesterday's Closing Price: $260.83 |
Daily Weekly Monthly
 |
| 20 Day Moving Average: 475,173 shares |
| Shares Outstanding: 30.66 (millions) |
| Market Capitalization: $7,997.83 (millions) |
| Beta: 1.50 |
| 52 Week High: $380.17 |
| 52 Week Low: $216.81 |
| Short Interest Ratio: |
| |
% Price Change |
% Price Change Relative to S&P 500 |
| 4 Week |
-16.73% |
-14.21% |
| 12 Week |
-27.51% |
-25.95% |
| Year To Date |
-27.56% |
-26.55% |
|
|
|
|
| |
|
|
| |
| • General Corporate Information |
Officers
Neil M. Ashe - Chairman; President; Chief Executive Officer and D
Karen J. Holcom - Senior Vice President and Chief Financial Officer
Marcia J. Avedon - Director
W. Patrick Battle - Director
Michael J. Bender - Director
|
|
Peer Information
Acuity, Inc. (EVOL)
Acuity, Inc. (RAMP)
Acuity, Inc. (LGTY)
Acuity, Inc. (ALOT)
Acuity, Inc. (CXT)
Acuity, Inc. (TGHI)
|
|
Industry / Sector / Ticker Info
Analyst Coverage: No
Industry Group: Technology Services
Sector: Business Services
CUSIP: 00508Y102
SIC: 3640
|
|
Fiscal Year
Fiscal Year End: August
Last Reported Quarter: 11/01/25
Next Expected EPS Date: 04/02/26
|
|
Share - Related Items
Shares Outstanding: 30.66
Most Recent Split Date: (:1)
Beta: 1.50
Market Capitalization: $7,997.83 (millions)
|
|
|
|
|
| |
| • EPS Information |
• Dividend Information |
| Analyst Coverage: No |
Dividend Yield: 0.31% |
| Current Fiscal Quarter EPS Consensus Estimate: $5.01 |
Indicated Annual Dividend: $0.80 |
| Current Fiscal Year EPS Consensus Estimate: $18.48 |
Payout Ratio: 0.04 |
| Number of Estimates in the Fiscal Year Consensus: 5.00 |
Change In Payout Ratio: -0.01 |
| Estmated Long-Term EPS Growth Rate: 10.00% |
Last Dividend Paid: 02/02/2026 - $0.20 |
| Next EPS Report Date: 04/02/26 |
|
|
|
| |