| Zacks Company Profile for BILL Holdings, Inc. (BILL : NYSE) |
|
|
| |
| • Company Description |
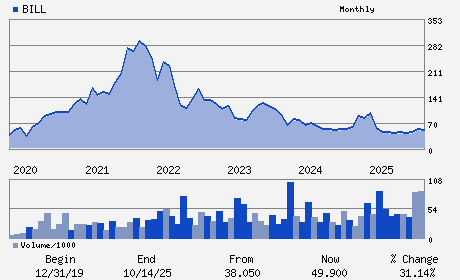
| BILL Holdings Inc. provides cloud-based software which simplifies, digitizes and automates back-office financial operations for small and midsize businesses. BILL Holdings Inc., formerly known as Bill.com Holdings Inc., is based in San Jose, California.
Number of Employees: 2,364 |
|
|
| |
| • Price / Volume Information |
| Yesterday's Closing Price: $39.79 |
Daily Weekly Monthly
 |
| 20 Day Moving Average: 1,852,092 shares |
| Shares Outstanding: 98.96 (millions) |
| Market Capitalization: $3,937.64 (millions) |
| Beta: 1.25 |
| 52 Week High: $57.21 |
| 52 Week Low: $35.46 |
| Short Interest Ratio: |
| |
% Price Change |
% Price Change Relative to S&P 500 |
| 4 Week |
-15.32% |
-12.72% |
| 12 Week |
-28.92% |
-26.75% |
| Year To Date |
-27.04% |
-24.70% |
|
|
|
|
| |
| • Address & Contact Information |
| Street Address |
Phone / Fax |
Email Address |
Web URL |
6220 AMERICA CENTER DRIVE SUITE 100
-
SAN JOSE,CA 95002
USA |
ph: 650-621-7700
fax: - |
investor@ir.bill.com |
http://www.bill.com |
|
|
| |
| • General Corporate Information |
Officers
Rene Lacerte - Chief Executive Officer and Director
Rohini Jain - Chief Financial Officer
Germaine Cota - Senior Vice President; Finance and Principal Accou
Aida Alvarez - Director
Steven Cakebread - Director
|
|
Peer Information
BILL Holdings, Inc. (ADP)
BILL Holdings, Inc. (CWLD)
BILL Holdings, Inc. (CYBA.)
BILL Holdings, Inc. (ZVLO)
BILL Holdings, Inc. (AZPN)
BILL Holdings, Inc. (ATIS)
|
|
Industry / Sector / Ticker Info
Analyst Coverage: No
Industry Group: INTERNET SOFTWARE
Sector: Computer and Technology
CUSIP: 090043100
SIC: 7372
|
|
Fiscal Year
Fiscal Year End: June
Last Reported Quarter: 12/01/25
Next Expected EPS Date: 05/14/26
|
|
Share - Related Items
Shares Outstanding: 98.96
Most Recent Split Date: (:1)
Beta: 1.25
Market Capitalization: $3,937.64 (millions)
|
|
|
|
|
| |
| • EPS Information |
• Dividend Information |
| Analyst Coverage: No |
Dividend Yield: 0.00% |
| Current Fiscal Quarter EPS Consensus Estimate: $0.08 |
Indicated Annual Dividend: $0.00 |
| Current Fiscal Year EPS Consensus Estimate: $0.56 |
Payout Ratio: 0.00 |
| Number of Estimates in the Fiscal Year Consensus: 7.00 |
Change In Payout Ratio: |
| Estmated Long-Term EPS Growth Rate: 15.19% |
Last Dividend Paid: NA - $0.00 |
| Next EPS Report Date: 05/14/26 |
|
|
|
| |