| Zacks Company Profile for Barnwell Industries, Inc. (BRN : AMEX) |
|
|
| |
| • Company Description |
| BARNWELL INDUSTRIES is engaged in oil and natural gas exploration, development, production and sales in Canada and the United States, investment in leasehold land in Hawaii, and water well drilling and water pumping system installation and repair in Hawaii. Additionally, they provide contract labor for the drilling and workovers of geothermal wells. Their oil and natural gas activities comprises its largest business segment. The other business segment is land investment activities and contract drilling activities.
Number of Employees: 18 |
|
|
| |
| • Price / Volume Information |
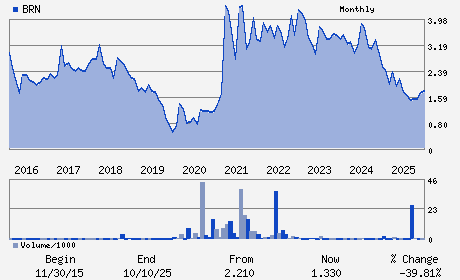
| Yesterday's Closing Price: $1.06 |
Daily Weekly Monthly
 |
| 20 Day Moving Average: 82,676 shares |
| Shares Outstanding: 14.40 (millions) |
| Market Capitalization: $15.26 (millions) |
| Beta: -0.04 |
| 52 Week High: $2.28 |
| 52 Week Low: $0.92 |
| Short Interest Ratio: |
| |
% Price Change |
% Price Change Relative to S&P 500 |
| 4 Week |
-3.64% |
-1.29% |
| 12 Week |
-6.19% |
-14.49% |
| Year To Date |
-4.50% |
-10.04% |
|
|
|
|
| |
| • Address & Contact Information |
| Street Address |
Phone / Fax |
Email Address |
Web URL |
24 Greenway Plaza Suite 1800Q
-
Houston,TX 77046
USA |
ph: 713-730-7026
fax: 808-531-7181 |
james@haydenir.com |
http://www.brninc.com |
|
|
| |
| • General Corporate Information |
Officers
Craig D. Hopkins - President and Chief Executive Officer
Kenneth S. Grossman - Chairman of the Board
Russell M. Gifford - Executive Vice President; Chief Financial Officer
Joshua S. Horowitz - Director
Philip J. McPherson - Director
|
|
Peer Information
Barnwell Industries, Inc. (AEGG)
Barnwell Industries, Inc. (CHAR)
Barnwell Industries, Inc. (CECX.)
Barnwell Industries, Inc. (DLOV)
Barnwell Industries, Inc. (WACC)
Barnwell Industries, Inc. (DVN)
|
|
Industry / Sector / Ticker Info
Analyst Coverage: No
Industry Group: OIL-US EXP&PROD
Sector: Oils/Energy
CUSIP: 068221100
SIC: 1311
|
|
Fiscal Year
Fiscal Year End: September
Last Reported Quarter: 03/01/26
Next Expected EPS Date: 08/12/26
|
|
Share - Related Items
Shares Outstanding: 14.40
Most Recent Split Date: 11.00 (3.00:1)
Beta: -0.04
Market Capitalization: $15.26 (millions)
|
|
|
|
|
| |
| • EPS Information |
• Dividend Information |
| Analyst Coverage: No |
Dividend Yield: 0.00% |
| Current Fiscal Quarter EPS Consensus Estimate: $ |
Indicated Annual Dividend: $0.00 |
| Current Fiscal Year EPS Consensus Estimate: $ |
Payout Ratio: |
| Number of Estimates in the Fiscal Year Consensus: |
Change In Payout Ratio: |
| Estmated Long-Term EPS Growth Rate: % |
Last Dividend Paid: NA - $0.00 |
| Next EPS Report Date: 08/12/26 |
|
|
|
| |