| Zacks Company Profile for BXP, Inc. (BXP : NYSE) |
|
|
| |
| • Company Description |
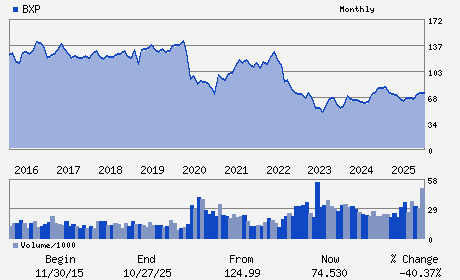
| BXP INC. is a real estate investment trust. The company is a developer, owner and manager of premier workplaces principally in the United States. BXP INC., formerly known as Boston Properties Inc., is based in BOSTON.
Number of Employees: 714 |
|
|
| |
| • Price / Volume Information |
| Yesterday's Closing Price: $52.84 |
Daily Weekly Monthly
 |
| 20 Day Moving Average: 3,310,947 shares |
| Shares Outstanding: 158.63 (millions) |
| Market Capitalization: $8,381.96 (millions) |
| Beta: 1.01 |
| 52 Week High: $79.33 |
| 52 Week Low: $49.72 |
| Short Interest Ratio: |
| |
% Price Change |
% Price Change Relative to S&P 500 |
| 4 Week |
-12.37% |
-7.66% |
| 12 Week |
-21.69% |
-18.68% |
| Year To Date |
-21.69% |
-18.68% |
|
|
|
|
| |
| • Address & Contact Information |
| Street Address |
Phone / Fax |
Email Address |
Web URL |
PRUDENTIAL CENTER 800 BOYLSTON STREET SUITE 1900
-
BOSTON,MA 02199
USA |
ph: 617-236-3300
fax: 302-655-5049 |
investorrelations@bxp.com |
http://www.bxp.com |
|
|
| |
| • General Corporate Information |
Officers
Owen D. Thomas - Chief Executive Officer and Chairman of the Board
Douglas T. Linde - President and Director
Michael E. LaBelle - Chief Financial Officer
Bruce W. Duncan - Director
Diane J. Hoskins - Director
|
|
Peer Information
BXP, Inc. (ARE)
BXP, Inc. (CUZ)
BXP, Inc. (FUR)
BXP, Inc. (NNN)
BXP, Inc. (FCH)
BXP, Inc. (CTO)
|
|
Industry / Sector / Ticker Info
Analyst Coverage: No
Industry Group: REIT-EQTY TRUST -OTHER
Sector: Finance
CUSIP: 101121101
SIC: 6798
|
|
Fiscal Year
Fiscal Year End: December
Last Reported Quarter: 12/01/25
Next Expected EPS Date: 05/05/26
|
|
Share - Related Items
Shares Outstanding: 158.63
Most Recent Split Date: (:1)
Beta: 1.01
Market Capitalization: $8,381.96 (millions)
|
|
|
|
|
| |
| • EPS Information |
• Dividend Information |
| Analyst Coverage: No |
Dividend Yield: 5.30% |
| Current Fiscal Quarter EPS Consensus Estimate: $1.59 |
Indicated Annual Dividend: $2.80 |
| Current Fiscal Year EPS Consensus Estimate: $6.99 |
Payout Ratio: 0.41 |
| Number of Estimates in the Fiscal Year Consensus: 9.00 |
Change In Payout Ratio: -0.14 |
| Estmated Long-Term EPS Growth Rate: 3.36% |
Last Dividend Paid: 12/31/2025 - $0.70 |
| Next EPS Report Date: 05/05/26 |
|
|
|
| |