| Zacks Company Profile for Bodycote (BYPLF : OTC) |
|
|
| |
| • Company Description |
| Bodycote PLC provides thermal processing services through heat treatment, metal joining, surface technology and Hot Isostatic Pressing. It serves aerospace, defense, automotive, power generation, oil & gas, construction, medical and transportation industry. Bodycote PLC is headquartered in Macclesfield, the United Kingdom.
Number of Employees: 4,379 |
|
|
| |
| • Price / Volume Information |
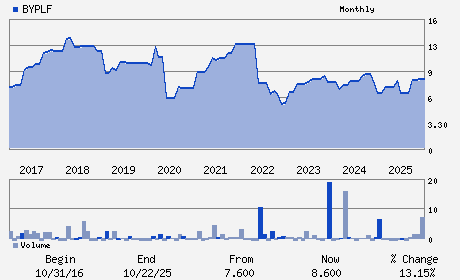
| Yesterday's Closing Price: $10.05 |
Daily Weekly Monthly
 |
| 20 Day Moving Average: 0 shares |
| Shares Outstanding: 177.48 (millions) |
| Market Capitalization: $1,783.66 (millions) |
| Beta: 0.45 |
| 52 Week High: $10.05 |
| 52 Week Low: $6.84 |
| Short Interest Ratio: |
| |
% Price Change |
% Price Change Relative to S&P 500 |
| 4 Week |
0.00% |
6.19% |
| 12 Week |
16.86% |
24.47% |
| Year To Date |
16.86% |
22.95% |
|
|
|
|
| |
|
|
| |
| • General Corporate Information |
Officers
Stephen Harris - Chief Executive Officer
Daniel Dayan - Chairman
Ben Fidler - Chief Financial Officer
Patrick Larmon - Director
Lili Chahbazi - Director
|
|
Peer Information
Bodycote (GENC)
Bodycote (BYPLF)
Bodycote (GBTG.)
Bodycote (ZBRA)
- (-)
- (-)
|
|
Industry / Sector / Ticker Info
Analyst Coverage: No
Industry Group: MACH-THRML PROC
Sector: Industrial Products
CUSIP: G1214R111
SIC: 3559
|
|
Fiscal Year
Fiscal Year End: December
Last Reported Quarter: -
Next Expected EPS Date: 06/10/26
|
|
Share - Related Items
Shares Outstanding: 177.48
Most Recent Split Date: (:1)
Beta: 0.45
Market Capitalization: $1,783.66 (millions)
|
|
|
|
|
| |
| • EPS Information |
• Dividend Information |
| Analyst Coverage: No |
Dividend Yield: 0.00% |
| Current Fiscal Quarter EPS Consensus Estimate: $ |
Indicated Annual Dividend: $0.00 |
| Current Fiscal Year EPS Consensus Estimate: $ |
Payout Ratio: |
| Number of Estimates in the Fiscal Year Consensus: |
Change In Payout Ratio: |
| Estmated Long-Term EPS Growth Rate: % |
Last Dividend Paid: NA - $0.00 |
| Next EPS Report Date: 06/10/26 |
|
|
|
| |