| Zacks Company Profile for Capricor Therapeutics, Inc. (CAPR : NSDQ) |
|
|
| |
| • Company Description |
| Capricor Therapeutics, Inc. is a biotechnology company. It is focused on the development of novel therapeutics to prevent and treat heart disease. The Company has two drug candidates in development: Cenderitide and CU-NP. Capricor Therapeutics, Inc., formerly known as Nile Therapeutics, Inc., is based in San Mateo, California.
Number of Employees: 231 |
|
|
| |
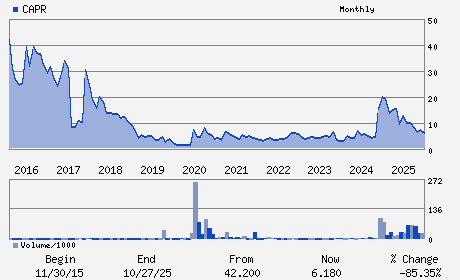
| • Price / Volume Information |
| Yesterday's Closing Price: $28.79 |
Daily Weekly Monthly
 |
| 20 Day Moving Average: 1,112,370 shares |
| Shares Outstanding: 57.91 (millions) |
| Market Capitalization: $1,667.29 (millions) |
| Beta: 0.48 |
| 52 Week High: $40.37 |
| 52 Week Low: $4.30 |
| Short Interest Ratio: |
| |
% Price Change |
% Price Change Relative to S&P 500 |
| 4 Week |
-16.77% |
-20.89% |
| 12 Week |
-1.23% |
-8.52% |
| Year To Date |
-0.24% |
-5.74% |
|
|
|
|
| |
| • Address & Contact Information |
| Street Address |
Phone / Fax |
Email Address |
Web URL |
10865 Road to the Cure Suite 150
-
San Diego,CA 92121
USA |
ph: 858-727-1755
fax: 415-875-7075 |
info@capricor.com |
http://www.capricor.com |
|
|
| |
| • General Corporate Information |
Officers
Linda Marban - Chief Executive Officer and Director
Frank Litvack - Executive Chairman and Director
Anthony J. Bergmann - Chief Financial Officer
David B. Musket - Director
George W. Dunbar - Director
|
|
Peer Information
Capricor Therapeutics, Inc. (BJCT)
Capricor Therapeutics, Inc. (CADMQ)
Capricor Therapeutics, Inc. (APNO)
Capricor Therapeutics, Inc. (UPDC)
Capricor Therapeutics, Inc. (IMTIQ)
Capricor Therapeutics, Inc. (CYGN)
|
|
Industry / Sector / Ticker Info
Analyst Coverage: No
Industry Group: MED PRODUCTS
Sector: Medical
CUSIP: 14070B309
SIC: 2834
|
|
Fiscal Year
Fiscal Year End: December
Last Reported Quarter: 03/01/26
Next Expected EPS Date: 08/10/26
|
|
Share - Related Items
Shares Outstanding: 57.91
Most Recent Split Date: 6.00 (0.10:1)
Beta: 0.48
Market Capitalization: $1,667.29 (millions)
|
|
|
|
|
| |
| • EPS Information |
• Dividend Information |
| Analyst Coverage: No |
Dividend Yield: 0.00% |
| Current Fiscal Quarter EPS Consensus Estimate: $-0.56 |
Indicated Annual Dividend: $0.00 |
| Current Fiscal Year EPS Consensus Estimate: $-0.38 |
Payout Ratio: |
| Number of Estimates in the Fiscal Year Consensus: 6.00 |
Change In Payout Ratio: |
| Estmated Long-Term EPS Growth Rate: % |
Last Dividend Paid: NA - $0.00 |
| Next EPS Report Date: 08/10/26 |
|
|
|
| |