| Zacks Company Profile for CarGurus, Inc. (CARG : NSDQ) |
|
|
| |
| • Company Description |
| CarGurus, Inc. is an online automotive marketplace connecting buyers and sellers of new and used cars. The company uses proprietary technology, search algorithms and data analytics. It operates primarily in Canada, the United Kingdom and Germany. CarGurus, Inc.is based in CAMBRIDGE, United States.
Number of Employees: 1,218 |
|
|
| |
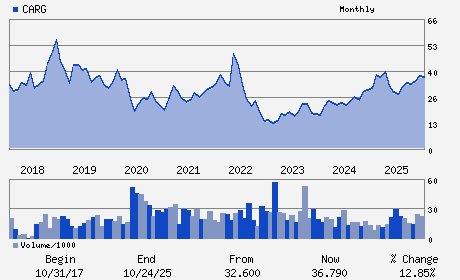
| • Price / Volume Information |
| Yesterday's Closing Price: $34.35 |
Daily Weekly Monthly
 |
| 20 Day Moving Average: 1,546,402 shares |
| Shares Outstanding: 95.19 (millions) |
| Market Capitalization: $3,269.75 (millions) |
| Beta: 1.37 |
| 52 Week High: $39.42 |
| 52 Week Low: $24.65 |
| Short Interest Ratio: |
| |
% Price Change |
% Price Change Relative to S&P 500 |
| 4 Week |
23.30% |
28.10% |
| 12 Week |
-10.96% |
-6.57% |
| Year To Date |
-10.43% |
-6.83% |
|
|
|
|
| |
|
|
| |
| • General Corporate Information |
Officers
Jason Trevisan - Chief Executive Officer and Director
Langley Steinert - Executive Chair and Chair of the Board
Steven Conine - Director
Manik Gupta - Director
Stephen Kaufer - Director
|
|
Peer Information
CarGurus, Inc. (COOL.)
CarGurus, Inc. (GFME)
CarGurus, Inc. (GSVI)
CarGurus, Inc. (GDENZ)
CarGurus, Inc. (EMUS)
CarGurus, Inc. (BFLY.)
|
|
Industry / Sector / Ticker Info
Analyst Coverage: No
Industry Group: INTERNET COMMERCE
Sector: Retail/Wholesale
CUSIP: 141788109
SIC: 7374
|
|
Fiscal Year
Fiscal Year End: December
Last Reported Quarter: 12/01/25
Next Expected EPS Date: 05/14/26
|
|
Share - Related Items
Shares Outstanding: 95.19
Most Recent Split Date: (:1)
Beta: 1.37
Market Capitalization: $3,269.75 (millions)
|
|
|
|
|
| |
| • EPS Information |
• Dividend Information |
| Analyst Coverage: No |
Dividend Yield: 0.00% |
| Current Fiscal Quarter EPS Consensus Estimate: $0.45 |
Indicated Annual Dividend: $0.00 |
| Current Fiscal Year EPS Consensus Estimate: $2.05 |
Payout Ratio: 0.00 |
| Number of Estimates in the Fiscal Year Consensus: 3.00 |
Change In Payout Ratio: 0.00 |
| Estmated Long-Term EPS Growth Rate: 13.00% |
Last Dividend Paid: NA - $0.00 |
| Next EPS Report Date: 05/14/26 |
|
|
|
| |