| Zacks Company Profile for Cavu Resources Inc. (CAVR : OTC) |
|
|
| |
| • Company Description |
| CAVU Resources, Inc. is a natural resource company engaged in the acquisition, exploration and development of oil and natural gas properties. It is engaged in providing contract drilling, fracture stimulation and directional drilling services to oil, natural gas exploration and production companies. The Company through its subsidiaries owns oil wells in Oklahoma, Kansas, Colorado, Montana and Texas. CAVU also owns pipelines in its area of operations and has acquired significant oil and gas equipment including rigs, trucks and completion equipment. CAVU Resources, Inc. is based in Carson City, Nevada.
Number of Employees: |
|
|
| |
| • Price / Volume Information |
| Yesterday's Closing Price: $0.00 |
Daily Weekly Monthly
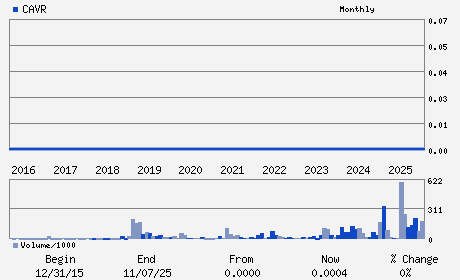 |
| 20 Day Moving Average: 1,637,352 shares |
| Shares Outstanding: 2,231.47 (millions) |
| Market Capitalization: $0.67 (millions) |
| Beta: -0.15 |
| 52 Week High: $0.00 |
| 52 Week Low: $0.00 |
| Short Interest Ratio: |
| |
% Price Change |
% Price Change Relative to S&P 500 |
| 4 Week |
0.00% |
-8.85% |
| 12 Week |
-25.00% |
-28.28% |
| Year To Date |
% |
% |
|
|
|
|
| |
| • Address & Contact Information |
| Street Address |
Phone / Fax |
Email Address |
Web URL |
-
-
-,- -
- |
ph: -
fax: - |
None |
None |
|
|
| |
| • General Corporate Information |
Officers
- - -
- - -
- - -
- - -
- - -
|
|
Peer Information
- (-)
- (-)
- (-)
- (-)
- (-)
- (-)
|
|
Industry / Sector / Ticker Info
Analyst Coverage: No
Industry Group: OIL-US EXP&PROD
Sector: Oils/Energy
CUSIP: 14965R104
SIC: 9999
|
|
Fiscal Year
Fiscal Year End: December
Last Reported Quarter: 06/01/25
Next Expected EPS Date: 05/21/26
|
|
Share - Related Items
Shares Outstanding: 2,231.47
Most Recent Split Date: (:1)
Beta: -0.15
Market Capitalization: $0.67 (millions)
|
|
|
|
|
| |
| • EPS Information |
• Dividend Information |
| Analyst Coverage: No |
Dividend Yield: 0.00% |
| Current Fiscal Quarter EPS Consensus Estimate: $ |
Indicated Annual Dividend: $0.00 |
| Current Fiscal Year EPS Consensus Estimate: $ |
Payout Ratio: |
| Number of Estimates in the Fiscal Year Consensus: |
Change In Payout Ratio: |
| Estmated Long-Term EPS Growth Rate: % |
Last Dividend Paid: NA - $0.00 |
| Next EPS Report Date: 05/21/26 |
|
|
|
| |