| Zacks Company Profile for Cardlytics, Inc. (CDLX : NSDQ) |
|
|
| |
| • Company Description |
| Cardlytics, Inc. is engaged in developing a purchase intelligence platform. The purchase data includes debit, credit and bill pay data from online and in-store transactions. It helps the marketers identify, reach and influence likely buyers at scale, and measure the impact of marketing spends. The Company also operates an advertising channel, Cardlytics Direct. Cardlytics Direct delivers tailored marketing for marketers and financial institutions. Cardlytics, Inc. is based in ATLANTA, United States.
Number of Employees: 275 |
|
|
| |
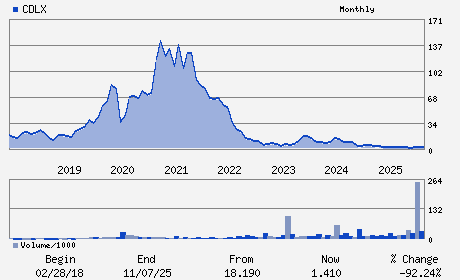
| • Price / Volume Information |
| Yesterday's Closing Price: $0.65 |
Daily Weekly Monthly
 |
| 20 Day Moving Average: 1,000,019 shares |
| Shares Outstanding: 57.61 (millions) |
| Market Capitalization: $37.50 (millions) |
| Beta: 0.67 |
| 52 Week High: $3.28 |
| 52 Week Low: $0.57 |
| Short Interest Ratio: |
| |
% Price Change |
% Price Change Relative to S&P 500 |
| 4 Week |
-33.60% |
-38.32% |
| 12 Week |
-30.19% |
-35.62% |
| Year To Date |
-43.39% |
-47.72% |
|
|
|
|
| |
|
|
| |
| • General Corporate Information |
Officers
Amit Gupta - Chief Executive Officer and Director
John Klinck - Chairman
David Evans - Chief Financial Officer
Andre Fernandez - Director
Jon Francis - Director
|
|
Peer Information
Cardlytics, Inc. (EVOL)
Cardlytics, Inc. (RAMP)
Cardlytics, Inc. (EFOR)
Cardlytics, Inc. (LGTY)
Cardlytics, Inc. (ALOT)
Cardlytics, Inc. (CXT)
|
|
Industry / Sector / Ticker Info
Analyst Coverage: No
Industry Group: Technology Services
Sector: Business Services
CUSIP: 14161W105
SIC: 7370
|
|
Fiscal Year
Fiscal Year End: December
Last Reported Quarter: 03/01/26
Next Expected EPS Date: 08/05/26
|
|
Share - Related Items
Shares Outstanding: 57.61
Most Recent Split Date: (:1)
Beta: 0.67
Market Capitalization: $37.50 (millions)
|
|
|
|
|
| |
| • EPS Information |
• Dividend Information |
| Analyst Coverage: No |
Dividend Yield: 0.00% |
| Current Fiscal Quarter EPS Consensus Estimate: $ |
Indicated Annual Dividend: $0.00 |
| Current Fiscal Year EPS Consensus Estimate: $-0.11 |
Payout Ratio: |
| Number of Estimates in the Fiscal Year Consensus: 1.00 |
Change In Payout Ratio: |
| Estmated Long-Term EPS Growth Rate: % |
Last Dividend Paid: NA - $0.00 |
| Next EPS Report Date: 08/05/26 |
|
|
|
| |