| Zacks Company Profile for Cadre Holdings, Inc. (CDRE : NYSE) |
|
|
| |
| • Company Description |
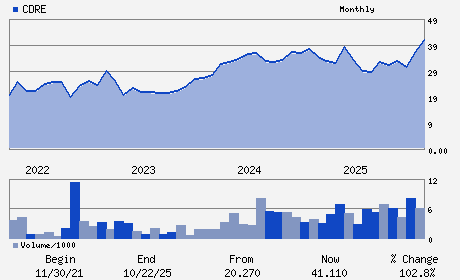
| Cadre Holdings Inc. is a manufacturer and distributer of safety and survivability equipment for first responders. The Company's core products include body armor, explosive ordnance disposal equipment and duty gear. Its primarily brands include Safariland(R) and Med-Eng(R). Cadre Holdings Inc. is headquartered in Jacksonville, Florida.
Number of Employees: 2,533 |
|
|
| |
| • Price / Volume Information |
| Yesterday's Closing Price: $31.61 |
Daily Weekly Monthly
 |
| 20 Day Moving Average: 462,068 shares |
| Shares Outstanding: 42.73 (millions) |
| Market Capitalization: $1,350.59 (millions) |
| Beta: 1.34 |
| 52 Week High: $48.76 |
| 52 Week Low: $27.07 |
| Short Interest Ratio: |
| |
% Price Change |
% Price Change Relative to S&P 500 |
| 4 Week |
-25.17% |
-22.25% |
| 12 Week |
-24.56% |
-20.84% |
| Year To Date |
-22.60% |
-19.49% |
|
|
|
|
| |
|
|
| |
| • General Corporate Information |
Officers
Warren B. Kanders - Chief Executive Officer
Blaine Browers - Chief Financial Officer
Hamish Norton - Director
Gianmaria C. Delzanno - Director
William Quigley - Director
|
|
Peer Information
Cadre Holdings, Inc. (BRC)
Cadre Holdings, Inc. (ALGI)
Cadre Holdings, Inc. (SYNX.)
Cadre Holdings, Inc. (ADSV)
Cadre Holdings, Inc. (CDCY)
Cadre Holdings, Inc. (CSCQ)
|
|
Industry / Sector / Ticker Info
Analyst Coverage: No
Industry Group: PROTECTION-SFTY
Sector: Industrial Products
CUSIP: 12763L105
SIC: 3842
|
|
Fiscal Year
Fiscal Year End: December
Last Reported Quarter: 12/01/25
Next Expected EPS Date: 05/05/26
|
|
Share - Related Items
Shares Outstanding: 42.73
Most Recent Split Date: (:1)
Beta: 1.34
Market Capitalization: $1,350.59 (millions)
|
|
|
|
|
| |
| • EPS Information |
• Dividend Information |
| Analyst Coverage: No |
Dividend Yield: 1.27% |
| Current Fiscal Quarter EPS Consensus Estimate: $0.10 |
Indicated Annual Dividend: $0.40 |
| Current Fiscal Year EPS Consensus Estimate: $1.21 |
Payout Ratio: 0.36 |
| Number of Estimates in the Fiscal Year Consensus: 3.00 |
Change In Payout Ratio: -0.33 |
| Estmated Long-Term EPS Growth Rate: 22.39% |
Last Dividend Paid: 01/30/2026 - $0.10 |
| Next EPS Report Date: 05/05/26 |
|
|
|
| |