| Zacks Company Profile for Clean Energy Technologies, Inc. (CETY : NSDQ) |
|
|
| |
| • Company Description |
| Clean Energy Technologies Inc. is a clean energy manufacturing and services company, offering recyclable energy solutions, clean energy fuels and alternative electric power for small and mid-sized projects principally in North America, Europe and Asia. Clean Energy Technologies Inc. is based in COSTA MESA, CA.
Number of Employees: 33 |
|
|
| |
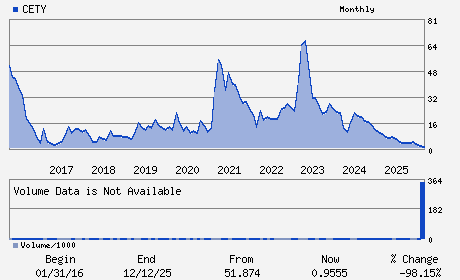
| • Price / Volume Information |
| Yesterday's Closing Price: $0.84 |
Daily Weekly Monthly
 |
| 20 Day Moving Average: 1,302,969 shares |
| Shares Outstanding: 5.34 (millions) |
| Market Capitalization: $4.51 (millions) |
| Beta: -1.31 |
| 52 Week High: $11.20 |
| 52 Week Low: $0.46 |
| Short Interest Ratio: |
| |
% Price Change |
% Price Change Relative to S&P 500 |
| 4 Week |
44.56% |
49.00% |
| 12 Week |
-3.18% |
-0.22% |
| Year To Date |
16.45% |
20.20% |
|
|
|
|
| |
|
|
| |
| • General Corporate Information |
Officers
Kambiz Mahdi - Chief Executive Officer; President and Director
Calvin Pang - Chief Financial Officer and Director
Ted Hsu - Director
Lauren Morrison - Director
Xiaotian Xiao - Director
|
|
Peer Information
Clean Energy Technologies, Inc. (APWR)
Clean Energy Technologies, Inc. (USFCQ)
Clean Energy Technologies, Inc. (SGII.)
Clean Energy Technologies, Inc. (APGI)
Clean Energy Technologies, Inc. (HYDP)
Clean Energy Technologies, Inc. (FCEL)
|
|
Industry / Sector / Ticker Info
Analyst Coverage: No
Industry Group: Other Alt Energy
Sector: Oils/Energy
CUSIP: 18452H305
SIC: 4924
|
|
Fiscal Year
Fiscal Year End: December
Last Reported Quarter: 09/01/25
Next Expected EPS Date: 04/13/26
|
|
Share - Related Items
Shares Outstanding: 5.34
Most Recent Split Date: 10.00 (0.07:1)
Beta: -1.31
Market Capitalization: $4.51 (millions)
|
|
|
|
|
| |
| • EPS Information |
• Dividend Information |
| Analyst Coverage: No |
Dividend Yield: 0.00% |
| Current Fiscal Quarter EPS Consensus Estimate: $ |
Indicated Annual Dividend: $0.00 |
| Current Fiscal Year EPS Consensus Estimate: $ |
Payout Ratio: |
| Number of Estimates in the Fiscal Year Consensus: |
Change In Payout Ratio: |
| Estmated Long-Term EPS Growth Rate: % |
Last Dividend Paid: NA - $0.00 |
| Next EPS Report Date: 04/13/26 |
|
|
|
| |