| Zacks Company Profile for CHOW TAI FOOK (CJEWY : OTC) |
|
|
| |
| • Company Description |
| Chow Tai Fook Jewellery Group manufactures and sells jewelry products. The Company sells rings, necklaces, earrings, pendants, bracelets and small statues. It operates primarily in China, Hong Kong, Macau, Taiwan, Malaysia and Singapore. Chow Tai Fook Jewellery Group is headquartered in Central, Hong Kong.
Number of Employees: 25,900 |
|
|
| |
| • Price / Volume Information |
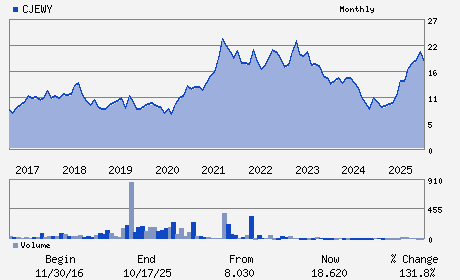
| Yesterday's Closing Price: $18.55 |
Daily Weekly Monthly
 |
| 20 Day Moving Average: 14 shares |
| Shares Outstanding: 986.49 (millions) |
| Market Capitalization: $18,299.47 (millions) |
| Beta: 0.22 |
| 52 Week High: $21.00 |
| 52 Week Low: $10.25 |
| Short Interest Ratio: |
| |
% Price Change |
% Price Change Relative to S&P 500 |
| 4 Week |
0.00% |
3.87% |
| 12 Week |
12.05% |
17.25% |
| Year To Date |
12.05% |
15.78% |
|
|
|
|
| |
|
|
| |
| • General Corporate Information |
Officers
Cheng Kar-Shun, Henry - Chairman
Cheng Chi-Heng, Conroy - Vice-chairman
Wong Siu-Kee, Kent - Director
Cheng Kam-Biu,Wilson - Director
Wong Siu-Kee - Director
|
|
Peer Information
CHOW TAI FOOK (KGJI)
CHOW TAI FOOK (JEWL)
CHOW TAI FOOK (OROA)
CHOW TAI FOOK (RJI.)
CHOW TAI FOOK (SIG)
CHOW TAI FOOK (ELA)
|
|
Industry / Sector / Ticker Info
Analyst Coverage: No
Industry Group: RETAIL-JEWELRY
Sector: Retail/Wholesale
CUSIP: 17044P106
SIC: 8880
|
|
Fiscal Year
Fiscal Year End: March
Last Reported Quarter: -
Next Expected EPS Date: -
|
|
Share - Related Items
Shares Outstanding: 986.49
Most Recent Split Date: (:1)
Beta: 0.22
Market Capitalization: $18,299.47 (millions)
|
|
|
|
|
| |
| • EPS Information |
• Dividend Information |
| Analyst Coverage: No |
Dividend Yield: 2.44% |
| Current Fiscal Quarter EPS Consensus Estimate: $ |
Indicated Annual Dividend: $0.45 |
| Current Fiscal Year EPS Consensus Estimate: $ |
Payout Ratio: |
| Number of Estimates in the Fiscal Year Consensus: |
Change In Payout Ratio: |
| Estmated Long-Term EPS Growth Rate: % |
Last Dividend Paid: 12/16/2025 - $0.23 |
| Next EPS Report Date: - |
|
|
|
| |