| Zacks Company Profile for Climb Global Solutions, Inc. (CLMB : NSDQ) |
|
|
| |
| • Company Description |
| Climb Global Solutions is a value-added IT distribution and solutions company specializing in emerging and disruptive technologies. The Company provides IT distribution and solutions for emerging companies principally in the Security, Data Management, Connectivity, Storage & HCI, Virtualization & Cloud, and Software & ALM industries. Climb Global Solutions, formerly known as Wayside Technology Group Inc., is based in EATONTOWN, N.J.
Number of Employees: 412 |
|
|
| |
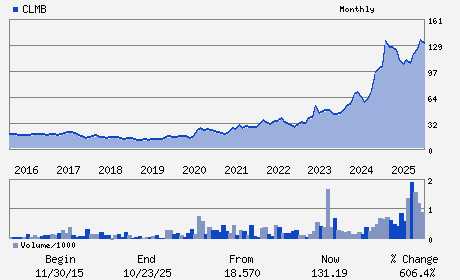
| • Price / Volume Information |
| Yesterday's Closing Price: $19.76 |
Daily Weekly Monthly
 |
| 20 Day Moving Average: 363,223 shares |
| Shares Outstanding: 18.42 (millions) |
| Market Capitalization: $364.03 (millions) |
| Beta: 1.18 |
| 52 Week High: $36.26 |
| 52 Week Low: $18.91 |
| Short Interest Ratio: |
| |
% Price Change |
% Price Change Relative to S&P 500 |
| 4 Week |
-20.78% |
-16.75% |
| 12 Week |
-23.58% |
-19.62% |
| Year To Date |
-23.10% |
-19.71% |
|
|
|
|
| |
|
|
| |
| • General Corporate Information |
Officers
Dale Foster - Chief Executive Officer
John McCarthy - Chairman
Matthew Sullivan - Chief Financial Officer
Andrew Bryant - Director
Gerri Gold - Director
|
|
Peer Information
Climb Global Solutions, Inc. (EVOL)
Climb Global Solutions, Inc. (RAMP)
Climb Global Solutions, Inc. (LGTY)
Climb Global Solutions, Inc. (ALOT)
Climb Global Solutions, Inc. (CXT)
Climb Global Solutions, Inc. (TGHI)
|
|
Industry / Sector / Ticker Info
Analyst Coverage: No
Industry Group: Technology Services
Sector: Business Services
CUSIP: 946760105
SIC: 5045
|
|
Fiscal Year
Fiscal Year End: December
Last Reported Quarter: 12/01/25
Next Expected EPS Date: 04/29/26
|
|
Share - Related Items
Shares Outstanding: 18.42
Most Recent Split Date: 3.00 (4.00:1)
Beta: 1.18
Market Capitalization: $364.03 (millions)
|
|
|
|
|
| |
| • EPS Information |
• Dividend Information |
| Analyst Coverage: No |
Dividend Yield: 0.86% |
| Current Fiscal Quarter EPS Consensus Estimate: $0.23 |
Indicated Annual Dividend: $0.17 |
| Current Fiscal Year EPS Consensus Estimate: $1.33 |
Payout Ratio: 0.13 |
| Number of Estimates in the Fiscal Year Consensus: 1.00 |
Change In Payout Ratio: -0.10 |
| Estmated Long-Term EPS Growth Rate: 12.00% |
Last Dividend Paid: NA - $0.00 |
| Next EPS Report Date: 04/29/26 |
|
|
|
| |