| Zacks Company Profile for CME Group Inc. (CME : NSDQ) |
|
|
| |
| • Company Description |
| CME Group is the largest futures exchange in the world in terms of trading volume as well as notional value traded. CME Group offers a broad range of products covering major asset classes, based on interest rates, equity indexes, foreign exchange, energy, agricultural commodities and metals. Trades are executed through CME Group's electronic trading platforms, open outcry and privately negotiated transactions. CME Group also operates one of the world's leading central counterparty clearing providers through CME Clearing and CME Clearing Europe, which offer clearing and settlement services across asset classes for exchange-traded and over-the-counter derivatives. Apart from CME and CBOT, the company operates New York Mercantile Exchange, Inc. (NYMEX) and Commodity Exchange, Inc. (COMEX), CME Clearing Europe Limited (CMECE) and CME Europe Limited (CME Europe). The company reports the results of its operations as one operating segment mainly comprised of CME, CBOT, NYMEX and COMEX.
Number of Employees: 3,875 |
|
|
| |
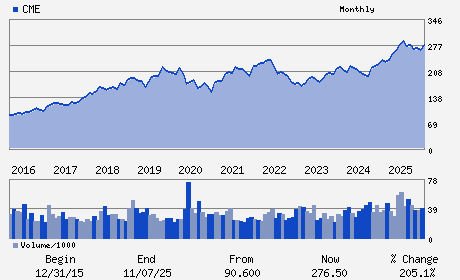
| • Price / Volume Information |
| Yesterday's Closing Price: $319.50 |
Daily Weekly Monthly
 |
| 20 Day Moving Average: 2,472,870 shares |
| Shares Outstanding: 360.60 (millions) |
| Market Capitalization: $115,211.62 (millions) |
| Beta: 0.24 |
| 52 Week High: $322.57 |
| 52 Week Low: $248.53 |
| Short Interest Ratio: |
| |
% Price Change |
% Price Change Relative to S&P 500 |
| 4 Week |
10.53% |
11.50% |
| 12 Week |
17.95% |
17.81% |
| Year To Date |
17.00% |
16.43% |
|
|
|
|
| |
|
|
| |
| • General Corporate Information |
Officers
Terrence A. Duffy - Chief Executive Officer;Chairman of the Board; Dir
Lynne Fitzpatrick - Senior Managing Director; President and Chief Fina
Jack Tobin - Managing Director and Chief Accounting Officer
Kathryn Benesh - Director
Timothy S. Bitsberger - Director
|
|
Peer Information
CME Group Inc. (SPGI)
CME Group Inc. (SOUM)
CME Group Inc. (CME)
CME Group Inc. (NDAQ)
CME Group Inc. (CBOE)
CME Group Inc. (NYX.)
|
|
Industry / Sector / Ticker Info
Analyst Coverage: No
Industry Group: Securities Exchanges
Sector: Finance
CUSIP: 12572Q105
SIC: 6200
|
|
Fiscal Year
Fiscal Year End: December
Last Reported Quarter: 12/01/25
Next Expected EPS Date: 04/22/26
|
|
Share - Related Items
Shares Outstanding: 360.60
Most Recent Split Date: 7.00 (5.00:1)
Beta: 0.24
Market Capitalization: $115,211.62 (millions)
|
|
|
|
|
| |
| • EPS Information |
• Dividend Information |
| Analyst Coverage: No |
Dividend Yield: 1.56% |
| Current Fiscal Quarter EPS Consensus Estimate: $2.97 |
Indicated Annual Dividend: $5.00 |
| Current Fiscal Year EPS Consensus Estimate: $11.77 |
Payout Ratio: 0.45 |
| Number of Estimates in the Fiscal Year Consensus: 13.00 |
Change In Payout Ratio: -0.06 |
| Estmated Long-Term EPS Growth Rate: 7.27% |
Last Dividend Paid: 12/12/2025 - $1.25 |
| Next EPS Report Date: 04/22/26 |
|
|
|
| |