| Zacks Company Profile for Core & Main, Inc. (CNM : NYSE) |
|
|
| |
| • Company Description |
| Core & Main Inc. is a specialized distributor of water, wastewater, storm drainage and fire protection products, and related services, to municipalities, private water companies and professional contractors across municipal, non-residential and residential end markets. The company's products and services are used in the maintenance, repair, replacement and construction of water and fire protection infrastructure. Core & Main Inc. is based in St. Louis.
Number of Employees: 5,700 |
|
|
| |
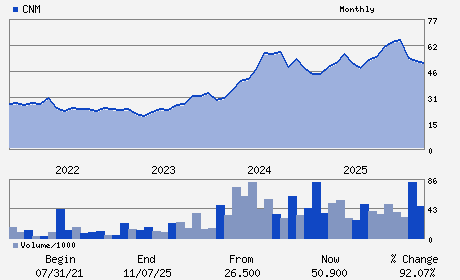
| • Price / Volume Information |
| Yesterday's Closing Price: $54.16 |
Daily Weekly Monthly
 |
| 20 Day Moving Average: 2,016,537 shares |
| Shares Outstanding: 195.51 (millions) |
| Market Capitalization: $10,588.95 (millions) |
| Beta: 0.98 |
| 52 Week High: $67.18 |
| 52 Week Low: $43.18 |
| Short Interest Ratio: |
| |
% Price Change |
% Price Change Relative to S&P 500 |
| 4 Week |
1.50% |
2.39% |
| 12 Week |
7.82% |
7.69% |
| Year To Date |
4.21% |
3.71% |
|
|
|
|
| |
|
|
| |
| • General Corporate Information |
Officers
Mark R. Witkowski - Chief Executive Officer and Director
Stephen O. LeClair - Executive Chairman
Bradford A. Cowles - President
Robyn L. Bradbury - Chief Financial Officer
Dennis G. Gipson - Director
|
|
Peer Information
Core & Main, Inc. (DVLGQ)
Core & Main, Inc. (CNM)
Core & Main, Inc. (FLOW.)
Core & Main, Inc. (AMDLY)
Core & Main, Inc. (HURC)
Core & Main, Inc. (LECO)
|
|
Industry / Sector / Ticker Info
Analyst Coverage: No
Industry Group: MACH TLS&RL PRD
Sector: Industrial Products
CUSIP: 21874C102
SIC: 5099
|
|
Fiscal Year
Fiscal Year End: January
Last Reported Quarter: 10/01/25
Next Expected EPS Date: 03/24/26
|
|
Share - Related Items
Shares Outstanding: 195.51
Most Recent Split Date: (:1)
Beta: 0.98
Market Capitalization: $10,588.95 (millions)
|
|
|
|
|
| |
| • EPS Information |
• Dividend Information |
| Analyst Coverage: No |
Dividend Yield: 0.00% |
| Current Fiscal Quarter EPS Consensus Estimate: $0.66 |
Indicated Annual Dividend: $0.00 |
| Current Fiscal Year EPS Consensus Estimate: $3.09 |
Payout Ratio: 0.00 |
| Number of Estimates in the Fiscal Year Consensus: 2.00 |
Change In Payout Ratio: 0.00 |
| Estmated Long-Term EPS Growth Rate: 8.80% |
Last Dividend Paid: NA - $0.00 |
| Next EPS Report Date: 03/24/26 |
|
|
|
| |