| Zacks Company Profile for Coursera, Inc. (COUR : NYSE) |
|
|
| |
| • Company Description |
| Coursera Inc. is an online learning platform. It partners with university and industry partners to offer a broad catalog of content and credentials, including Guided Projects, courses, Specializations, certificates and bachelor's and master's degrees. Coursera Inc. is based in Mountain View, United States.
Number of Employees: 1,307 |
|
|
| |
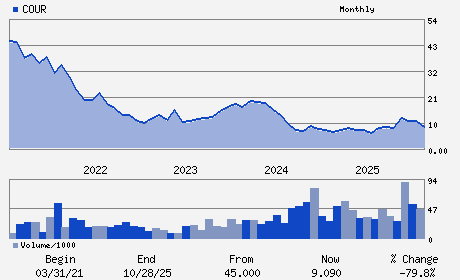
| • Price / Volume Information |
| Yesterday's Closing Price: $5.51 |
Daily Weekly Monthly
 |
| 20 Day Moving Average: 4,248,101 shares |
| Shares Outstanding: 169.31 (millions) |
| Market Capitalization: $932.92 (millions) |
| Beta: 1.35 |
| 52 Week High: $13.56 |
| 52 Week Low: $5.47 |
| Short Interest Ratio: |
| |
% Price Change |
% Price Change Relative to S&P 500 |
| 4 Week |
-14.04% |
-7.16% |
| 12 Week |
-22.17% |
-16.19% |
| Year To Date |
-25.14% |
-19.53% |
|
|
|
|
| |
| • Address & Contact Information |
| Street Address |
Phone / Fax |
Email Address |
Web URL |
2440 West El Camino Real Suite 500
-
MOUNTAIN VIEW,CA 94040
USA |
ph: 650-963-9884
fax: - |
ir@coursera.org |
http://www.coursera.org |
|
|
| |
| • General Corporate Information |
Officers
Gregory M. Hart - President; Chief Executive Officer and Director
Andrew Y. Ng - Chairman
Michael Foley - Senior Vice President; Chief Financial Officer and
Carmen Chang - Director
Amanda M. Clark - Director
|
|
Peer Information
Coursera, Inc. (EVOL)
Coursera, Inc. (RAMP)
Coursera, Inc. (LGTY)
Coursera, Inc. (ALOT)
Coursera, Inc. (CXT)
Coursera, Inc. (TGHI)
|
|
Industry / Sector / Ticker Info
Analyst Coverage: No
Industry Group: Technology Services
Sector: Business Services
CUSIP: 22266M104
SIC: 7372
|
|
Fiscal Year
Fiscal Year End: December
Last Reported Quarter: 12/01/25
Next Expected EPS Date: 04/23/26
|
|
Share - Related Items
Shares Outstanding: 169.31
Most Recent Split Date: (:1)
Beta: 1.35
Market Capitalization: $932.92 (millions)
|
|
|
|
|
| |
| • EPS Information |
• Dividend Information |
| Analyst Coverage: No |
Dividend Yield: 0.00% |
| Current Fiscal Quarter EPS Consensus Estimate: $-0.06 |
Indicated Annual Dividend: $0.00 |
| Current Fiscal Year EPS Consensus Estimate: $-0.13 |
Payout Ratio: |
| Number of Estimates in the Fiscal Year Consensus: 5.00 |
Change In Payout Ratio: |
| Estmated Long-Term EPS Growth Rate: 16.35% |
Last Dividend Paid: NA - $0.00 |
| Next EPS Report Date: 04/23/26 |
|
|
|
| |