| Zacks Company Profile for Comstock Resources, Inc. (CRK : NYSE) |
|
|
| |
| • Company Description |
| Comstock Resources, Inc. is an independent energy company engaged in the acquisition, development, production and exploration of oil and natural gas properties. The company's oil and natural gas reserve base is entirely concentrated in the Gulf of Mexico, Southeast Texas and East Texas/North Louisiana regions.
Number of Employees: 252 |
|
|
| |
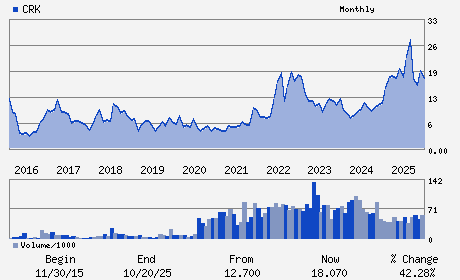
| • Price / Volume Information |
| Yesterday's Closing Price: $17.33 |
Daily Weekly Monthly
 |
| 20 Day Moving Average: 2,059,838 shares |
| Shares Outstanding: 293.70 (millions) |
| Market Capitalization: $5,089.75 (millions) |
| Beta: 0.22 |
| 52 Week High: $31.17 |
| 52 Week Low: $14.65 |
| Short Interest Ratio: |
| |
% Price Change |
% Price Change Relative to S&P 500 |
| 4 Week |
-10.30% |
-18.24% |
| 12 Week |
-15.13% |
-18.84% |
| Year To Date |
-25.24% |
-29.50% |
|
|
|
|
| |
|
|
| |
| • General Corporate Information |
Officers
M. Jay Allison - Chief Executive Officer and Chairman of the Board
Roland O. Burns - President; Chief Financial Officer; Secretary and
Daniel S. Harrison - Chief Operating Officer
Patrick H. McGough - Vice President of Operations
Ronald E. Mills - Vice President of Finance and Investor Relations
|
|
Peer Information
Comstock Resources, Inc. (AEGG)
Comstock Resources, Inc. (CHAR)
Comstock Resources, Inc. (CECX.)
Comstock Resources, Inc. (DLOV)
Comstock Resources, Inc. (WACC)
Comstock Resources, Inc. (DVN)
|
|
Industry / Sector / Ticker Info
Analyst Coverage: No
Industry Group: OIL-US EXP&PROD
Sector: Oils/Energy
CUSIP: 205768302
SIC: 1311
|
|
Fiscal Year
Fiscal Year End: December
Last Reported Quarter: 03/01/26
Next Expected EPS Date: 07/29/26
|
|
Share - Related Items
Shares Outstanding: 293.70
Most Recent Split Date: 8.00 (0.20:1)
Beta: 0.22
Market Capitalization: $5,089.75 (millions)
|
|
|
|
|
| |
| • EPS Information |
• Dividend Information |
| Analyst Coverage: No |
Dividend Yield: 0.00% |
| Current Fiscal Quarter EPS Consensus Estimate: $0.07 |
Indicated Annual Dividend: $0.00 |
| Current Fiscal Year EPS Consensus Estimate: $0.67 |
Payout Ratio: 0.00 |
| Number of Estimates in the Fiscal Year Consensus: 5.00 |
Change In Payout Ratio: -0.12 |
| Estmated Long-Term EPS Growth Rate: % |
Last Dividend Paid: NA - $0.00 |
| Next EPS Report Date: 07/29/26 |
|
|
|
| |