| Zacks Company Profile for Curaleaf Holdings, Inc. (CURLF : OTC) |
|
|
| |
| • Company Description |
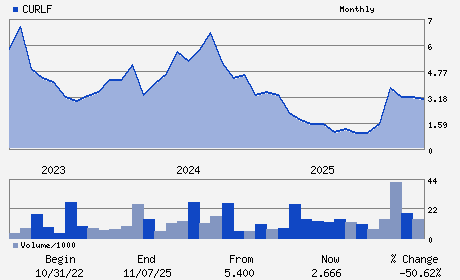
| Curaleaf Holdings Inc. operates as a holding company, through its subsidiaries, engages in the production and distribution of cannabis products. Curaleaf Holdings serves dispensary and cultivation sites principally in North America. Curaleaf Holdings Inc. is based in Wakefield, Massachusetts.
Number of Employees: 5,554 |
|
|
| |
| • Price / Volume Information |
| Yesterday's Closing Price: $3.94 |
Daily Weekly Monthly
 |
| 20 Day Moving Average: 1,670,002 shares |
| Shares Outstanding: 698.20 (millions) |
| Market Capitalization: $2,750.89 (millions) |
| Beta: 1.58 |
| 52 Week High: $5.05 |
| 52 Week Low: $0.73 |
| Short Interest Ratio: |
| |
% Price Change |
% Price Change Relative to S&P 500 |
| 4 Week |
50.96% |
41.70% |
| 12 Week |
50.96% |
38.09% |
| Year To Date |
56.35% |
42.68% |
|
|
|
|
| |
| • Address & Contact Information |
| Street Address |
Phone / Fax |
Email Address |
Web URL |
666 Burrard Street Suite 1700
-
Vancouver,A1 V6C 2XB
CAN |
ph: 781-451-0351
fax: - |
ir@curaleaf.com |
http://www.curaleaf.com |
|
|
| |
| • General Corporate Information |
Officers
Boris Jordan - Chief Executive Officer and Chairman
Joseph F. Lusardi - Executive Vice-Chairman
Rahul Pinto - President
Ed Kremer - Chief Financial Officer
Brian St. Peter - Senior Vice President
|
|
Peer Information
Curaleaf Holdings, Inc. (BJCT)
Curaleaf Holdings, Inc. (CADMQ)
Curaleaf Holdings, Inc. (APNO)
Curaleaf Holdings, Inc. (UPDC)
Curaleaf Holdings, Inc. (IMTIQ)
Curaleaf Holdings, Inc. (CYGN)
|
|
Industry / Sector / Ticker Info
Analyst Coverage: No
Industry Group: MED PRODUCTS
Sector: Medical
CUSIP: 23126M102
SIC: 2833
|
|
Fiscal Year
Fiscal Year End: December
Last Reported Quarter: 03/01/26
Next Expected EPS Date: 08/05/26
|
|
Share - Related Items
Shares Outstanding: 698.20
Most Recent Split Date: (:1)
Beta: 1.58
Market Capitalization: $2,750.89 (millions)
|
|
|
|
|
| |
| • EPS Information |
• Dividend Information |
| Analyst Coverage: No |
Dividend Yield: 0.00% |
| Current Fiscal Quarter EPS Consensus Estimate: $-0.06 |
Indicated Annual Dividend: $0.00 |
| Current Fiscal Year EPS Consensus Estimate: $-0.12 |
Payout Ratio: |
| Number of Estimates in the Fiscal Year Consensus: 5.00 |
Change In Payout Ratio: |
| Estmated Long-Term EPS Growth Rate: % |
Last Dividend Paid: NA - $0.00 |
| Next EPS Report Date: 08/05/26 |
|
|
|
| |