| Zacks Company Profile for Daktronics, Inc. (DAKT : NSDQ) |
|
|
| |
| • Company Description |
| Daktronics Inc. has strong leadership positions in, and is one of the world's largest suppliers of, electronic scoreboards, computer-programmable displays, and large screen video displays and control systems. The company excels in the control of large display systems, including those that require integration of multiple complex displays showing real-time information, graphics, animation and video. Daktronics designs, manufactures, markets and services display systems for customers around the world in sport, business and transportation applications.
Number of Employees: 2,702 |
|
|
| |
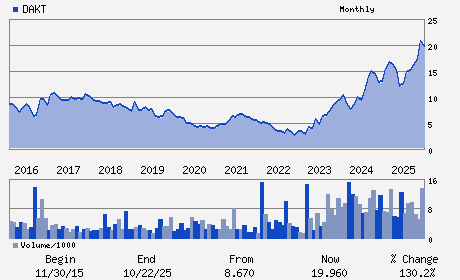
| • Price / Volume Information |
| Yesterday's Closing Price: $20.82 |
Daily Weekly Monthly
 |
| 20 Day Moving Average: 739,029 shares |
| Shares Outstanding: 48.30 (millions) |
| Market Capitalization: $1,005.57 (millions) |
| Beta: 1.70 |
| 52 Week High: $28.26 |
| 52 Week Low: $10.92 |
| Short Interest Ratio: |
| |
% Price Change |
% Price Change Relative to S&P 500 |
| 4 Week |
-24.29% |
-21.34% |
| 12 Week |
9.23% |
14.62% |
| Year To Date |
5.31% |
9.54% |
|
|
|
|
| |
|
|
| |
| • General Corporate Information |
Officers
Brad T. Wiemann - Interim President & Chief Executive Officer
Howard I. Atkins - Acting Chief Financial Officer
Shereta D. Williams - Director
Lance D. Bultena - Director
Andrew D. Siegel - Director
|
|
Peer Information
Daktronics, Inc. (REFR)
Daktronics, Inc. (BELFA)
Daktronics, Inc. (DIPC)
Daktronics, Inc. (V.SSC)
Daktronics, Inc. (BNSOF)
Daktronics, Inc. (CUB.)
|
|
Industry / Sector / Ticker Info
Analyst Coverage: No
Industry Group: ELEC PRODS-MISC
Sector: Computer and Technology
CUSIP: 234264109
SIC: 3990
|
|
Fiscal Year
Fiscal Year End: April
Last Reported Quarter: 01/01/26
Next Expected EPS Date: 06/24/26
|
|
Share - Related Items
Shares Outstanding: 48.30
Most Recent Split Date: 6.00 (2.00:1)
Beta: 1.70
Market Capitalization: $1,005.57 (millions)
|
|
|
|
|
| |
| • EPS Information |
• Dividend Information |
| Analyst Coverage: No |
Dividend Yield: 0.00% |
| Current Fiscal Quarter EPS Consensus Estimate: $0.28 |
Indicated Annual Dividend: $0.00 |
| Current Fiscal Year EPS Consensus Estimate: $1.06 |
Payout Ratio: 0.00 |
| Number of Estimates in the Fiscal Year Consensus: 1.00 |
Change In Payout Ratio: 0.00 |
| Estmated Long-Term EPS Growth Rate: 30.00% |
Last Dividend Paid: NA - $0.00 |
| Next EPS Report Date: 06/24/26 |
|
|
|
| |