| Zacks Company Profile for DuPont de Nemours, Inc. (DD : NYSE) |
|
|
| |
| • Company Description |
| DuPont provides technology-based materials, ingredients and solutions. It serves markets including electronics, transportation, construction, health and wellness, food and worker safety. The company has strong geographic, customer and end-market diversification and leading positions in core markets with businesses aligned with high-growth market trends.
Number of Employees: 15,000 |
|
|
| |
| • Price / Volume Information |
| Yesterday's Closing Price: $45.99 |
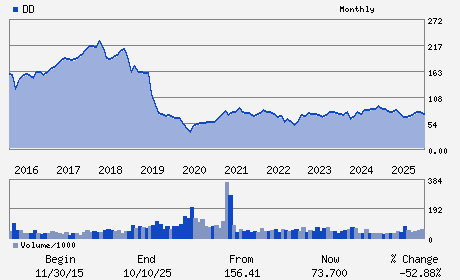
Daily Weekly Monthly
 |
| 20 Day Moving Average: 4,103,158 shares |
| Shares Outstanding: 408.92 (millions) |
| Market Capitalization: $18,806.41 (millions) |
| Beta: 1.10 |
| 52 Week High: $52.66 |
| 52 Week Low: $22.19 |
| Short Interest Ratio: |
| |
% Price Change |
% Price Change Relative to S&P 500 |
| 4 Week |
-10.75% |
-8.57% |
| 12 Week |
13.28% |
12.37% |
| Year To Date |
14.40% |
15.58% |
|
|
|
|
| |
|
|
| |
| • General Corporate Information |
Officers
Lori D. Koch - Chief Executive Officer and Director
Edward D. Breen - Chairman
Antonella B. Franzen - Senior Vice President and Chief Financial Office
Madeleine G. Barber - Vice President of Tax; Controller and Chief Accoun
Amy G. Brady - Director
|
|
Peer Information
DuPont de Nemours, Inc. (ENFY)
DuPont de Nemours, Inc. (EMLIF)
DuPont de Nemours, Inc. (GPLB)
DuPont de Nemours, Inc. (BCPUQ)
DuPont de Nemours, Inc. (CYT.)
DuPont de Nemours, Inc. (SOA)
|
|
Industry / Sector / Ticker Info
Analyst Coverage: No
Industry Group: CHEM-DIVERSIFD
Sector: Basic Materials
CUSIP: 26614N102
SIC: 2821
|
|
Fiscal Year
Fiscal Year End: December
Last Reported Quarter: 12/01/25
Next Expected EPS Date: 05/01/26
|
|
Share - Related Items
Shares Outstanding: 408.92
Most Recent Split Date: 6.00 (0.33:1)
Beta: 1.10
Market Capitalization: $18,806.41 (millions)
|
|
|
|
|
| |
| • EPS Information |
• Dividend Information |
| Analyst Coverage: No |
Dividend Yield: 1.74% |
| Current Fiscal Quarter EPS Consensus Estimate: $0.49 |
Indicated Annual Dividend: $0.80 |
| Current Fiscal Year EPS Consensus Estimate: $2.30 |
Payout Ratio: 0.22 |
| Number of Estimates in the Fiscal Year Consensus: 5.00 |
Change In Payout Ratio: -0.15 |
| Estmated Long-Term EPS Growth Rate: 17.42% |
Last Dividend Paid: 03/02/2026 - $0.20 |
| Next EPS Report Date: 05/01/26 |
|
|
|
| |