| Zacks Company Profile for DINE BRANDS GLOBAL, INC. (DIN : NYSE) |
|
|
| |
| • Company Description |
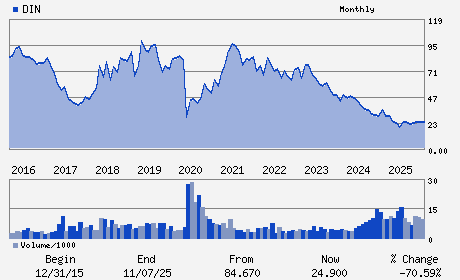
| Dine Brands Global, Inc. is a full-service dining company. It operates and franchises restaurants under both the Applebee's Neighborhood Grill & Bar and IHOP brands. The company's Applebee's restaurants offer casual food, drinks, casual dining, and table services and IHOP restaurants provide full table services, and food and beverage offerings. Dine Brands Global, Inc. formerly known as Dine Equity Inc., is headquartered in Glendale, California.
Number of Employees: 992 |
|
|
| |
| • Price / Volume Information |
| Yesterday's Closing Price: $32.95 |
Daily Weekly Monthly
 |
| 20 Day Moving Average: 473,523 shares |
| Shares Outstanding: 14.42 (millions) |
| Market Capitalization: $475.26 (millions) |
| Beta: 0.91 |
| 52 Week High: $35.34 |
| 52 Week Low: $18.63 |
| Short Interest Ratio: |
| |
% Price Change |
% Price Change Relative to S&P 500 |
| 4 Week |
9.00% |
6.73% |
| 12 Week |
33.29% |
29.02% |
| Year To Date |
9.47% |
-6.82% |
|
|
|
|
| |
| • Address & Contact Information |
| Street Address |
Phone / Fax |
Email Address |
Web URL |
10 WEST WALNUT STREET 5TH FLOOR
-
PASADENA,CA 91103
USA |
ph: 818-240-6055
fax: 818-637-3131 |
ir@dinebrands.com |
http://www.dinebrands.com |
|
|
| |
| • General Corporate Information |
Officers
John W. Peyton - Chief Executive Officer and Director
Richard J. Dahl - Chairman and Director
Vance Y. Chang - Chief Financial Officer
Allison Hall - Chief Accounting Officer
Howard M. Berk - Director
|
|
Peer Information
DINE BRANDS GLOBAL, INC. (BH)
DINE BRANDS GLOBAL, INC. (BUCA)
DINE BRANDS GLOBAL, INC. (BUNZQ)
DINE BRANDS GLOBAL, INC. (FRRG)
DINE BRANDS GLOBAL, INC. (CHEF.)
DINE BRANDS GLOBAL, INC. (BGMTQ)
|
|
Industry / Sector / Ticker Info
Analyst Coverage: No
Industry Group: RETAIL-RESTRNTS
Sector: Retail/Wholesale
CUSIP: 254423106
SIC: 5812
|
|
Fiscal Year
Fiscal Year End: December
Last Reported Quarter: 09/01/25
Next Expected EPS Date: 03/04/26
|
|
Share - Related Items
Shares Outstanding: 14.42
Most Recent Split Date: 5.00 (2.00:1)
Beta: 0.91
Market Capitalization: $475.26 (millions)
|
|
|
|
|
| |
| • EPS Information |
• Dividend Information |
| Analyst Coverage: No |
Dividend Yield: 2.31% |
| Current Fiscal Quarter EPS Consensus Estimate: $1.12 |
Indicated Annual Dividend: $0.76 |
| Current Fiscal Year EPS Consensus Estimate: $4.05 |
Payout Ratio: 0.54 |
| Number of Estimates in the Fiscal Year Consensus: 2.00 |
Change In Payout Ratio: 0.26 |
| Estmated Long-Term EPS Growth Rate: % |
Last Dividend Paid: NA - $0.00 |
| Next EPS Report Date: 03/04/26 |
|
|
|
| |