| Zacks Company Profile for DigitalOcean Holdings, Inc. (DOCN : NYSE) |
|
|
| |
| • Company Description |
| DigitalOcean helps developers, startups and small and medium-sized businesses rapidly build, deploy and scale applications to accelerate innovation and increase productivity and agility. DigitalOcean is based in New York, United States.
Number of Employees: 1,462 |
|
|
| |
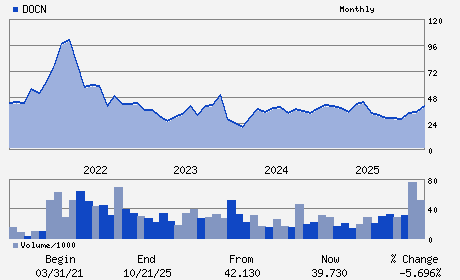
| • Price / Volume Information |
| Yesterday's Closing Price: $82.65 |
Daily Weekly Monthly
 |
| 20 Day Moving Average: 4,064,605 shares |
| Shares Outstanding: 92.00 (millions) |
| Market Capitalization: $7,603.48 (millions) |
| Beta: 1.76 |
| 52 Week High: $86.50 |
| 52 Week Low: $25.45 |
| Short Interest Ratio: |
| |
% Price Change |
% Price Change Relative to S&P 500 |
| 4 Week |
29.89% |
37.94% |
| 12 Week |
66.90% |
77.76% |
| Year To Date |
71.76% |
80.71% |
|
|
|
|
| |
|
|
| |
| • General Corporate Information |
Officers
Padmanabhan Srinivasan - Chief Executive Officer and Director
W. Matthew Steinfort - Chief Financial Officer
Cherie Barrett - Chief Accounting Officer
Warren Adelman - Director
Pratima Arora - Director
|
|
Peer Information
DigitalOcean Holdings, Inc. (ADP)
DigitalOcean Holdings, Inc. (CWLD)
DigitalOcean Holdings, Inc. (CYBA.)
DigitalOcean Holdings, Inc. (ZVLO)
DigitalOcean Holdings, Inc. (AZPN)
DigitalOcean Holdings, Inc. (ATIS)
|
|
Industry / Sector / Ticker Info
Analyst Coverage: No
Industry Group: INTERNET SOFTWARE
Sector: Computer and Technology
CUSIP: 25402D102
SIC: 7370
|
|
Fiscal Year
Fiscal Year End: December
Last Reported Quarter: 12/01/25
Next Expected EPS Date: 05/05/26
|
|
Share - Related Items
Shares Outstanding: 92.00
Most Recent Split Date: (:1)
Beta: 1.76
Market Capitalization: $7,603.48 (millions)
|
|
|
|
|
| |
| • EPS Information |
• Dividend Information |
| Analyst Coverage: No |
Dividend Yield: 0.00% |
| Current Fiscal Quarter EPS Consensus Estimate: $0.12 |
Indicated Annual Dividend: $0.00 |
| Current Fiscal Year EPS Consensus Estimate: $0.42 |
Payout Ratio: 0.00 |
| Number of Estimates in the Fiscal Year Consensus: 6.00 |
Change In Payout Ratio: 0.00 |
| Estmated Long-Term EPS Growth Rate: 2.45% |
Last Dividend Paid: NA - $0.00 |
| Next EPS Report Date: 05/05/26 |
|
|
|
| |