| Zacks Company Profile for Docusign Inc. (DOCU : NSDQ) |
|
|
| |
| • Company Description |
| DocuSign is a global provider of cloud-based software. The company's DocuSign Agreement Cloud is a cloud software suite that automates and connects the entire agreement process. Agreement cloud products include e-signature, DocuSign's anchor product that helps businesses prepare, sign, act on, and manage agreements digitally; Contract Lifecycle Management, which automates workflows across agreement process; Insight, which scouts and analyzes agreements by legal concepts and clauses using artificial intelligence; Analyzer, which acts as a add-on to insight and analyzes inbound agreements, detectingclauses by type, scoring their risk, and extracting important terms.
Number of Employees: 7,044 |
|
|
| |
| • Price / Volume Information |
| Yesterday's Closing Price: $47.23 |
Daily Weekly Monthly
 |
| 20 Day Moving Average: 6,003,330 shares |
| Shares Outstanding: 194.43 (millions) |
| Market Capitalization: $9,182.83 (millions) |
| Beta: 1.03 |
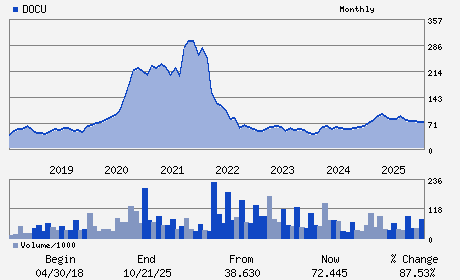
| 52 Week High: $94.67 |
| 52 Week Low: $40.16 |
| Short Interest Ratio: |
| |
% Price Change |
% Price Change Relative to S&P 500 |
| 4 Week |
6.18% |
12.76% |
| 12 Week |
-32.50% |
-28.11% |
| Year To Date |
-30.95% |
-27.35% |
|
|
|
|
| |
|
|
| |
| • General Corporate Information |
Officers
Allan Thygesen - Chief Executive Officer
James Beer - Chairman
Blake Grayson - Chief Financial Officer
Teresa Briggs - Director
Cain A. Hayes - Director
|
|
Peer Information
Docusign Inc. (ADP)
Docusign Inc. (CWLD)
Docusign Inc. (CYBA.)
Docusign Inc. (ZVLO)
Docusign Inc. (AZPN)
Docusign Inc. (ATIS)
|
|
Industry / Sector / Ticker Info
Analyst Coverage: No
Industry Group: INTERNET SOFTWARE
Sector: Computer and Technology
CUSIP: 256163106
SIC: 7372
|
|
Fiscal Year
Fiscal Year End: January
Last Reported Quarter: 01/01/26
Next Expected EPS Date: 06/04/26
|
|
Share - Related Items
Shares Outstanding: 194.43
Most Recent Split Date: (:1)
Beta: 1.03
Market Capitalization: $9,182.83 (millions)
|
|
|
|
|
| |
| • EPS Information |
• Dividend Information |
| Analyst Coverage: No |
Dividend Yield: 0.00% |
| Current Fiscal Quarter EPS Consensus Estimate: $0.35 |
Indicated Annual Dividend: $0.00 |
| Current Fiscal Year EPS Consensus Estimate: $1.70 |
Payout Ratio: 0.00 |
| Number of Estimates in the Fiscal Year Consensus: 8.00 |
Change In Payout Ratio: 0.00 |
| Estmated Long-Term EPS Growth Rate: 14.29% |
Last Dividend Paid: NA - $0.00 |
| Next EPS Report Date: 06/04/26 |
|
|
|
| |