| Zacks Company Profile for Dynatrace, Inc. (DT : NYSE) |
|
|
| |
| • Company Description |
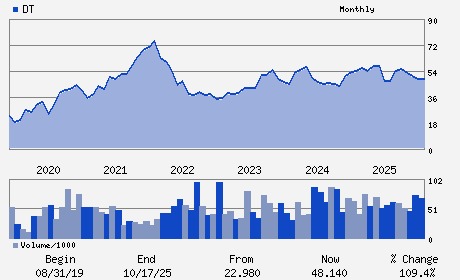
| Dynatrace Inc. is a software intelligence company. It is engaged in providing application performance management, artificial intelligence for operations, cloud infrastructure monitoring and digital experience management. Dynatrace Inc. is based in Waltham, United States.
Number of Employees: 5,200 |
|
|
| |
| • Price / Volume Information |
| Yesterday's Closing Price: $40.24 |
Daily Weekly Monthly
 |
| 20 Day Moving Average: 7,849,419 shares |
| Shares Outstanding: 298.25 (millions) |
| Market Capitalization: $12,001.62 (millions) |
| Beta: 0.82 |
| 52 Week High: $57.55 |
| 52 Week Low: $32.83 |
| Short Interest Ratio: |
| |
% Price Change |
% Price Change Relative to S&P 500 |
| 4 Week |
10.49% |
14.77% |
| 12 Week |
-8.02% |
-3.76% |
| Year To Date |
-7.15% |
-4.06% |
|
|
|
|
| |
|
|
| |
| • General Corporate Information |
Officers
Rick McConnell - Chief Executive Officer and Director
Jill Ward - Director; Board Chair
James Benson - Chief Financial Officer and Treasurer
Daniel Yates - Chief Accounting Officer
Lisa Campbell - Director
|
|
Peer Information
Dynatrace, Inc. (UIS)
Dynatrace, Inc. (CTSH)
Dynatrace, Inc. (ASGN)
Dynatrace, Inc. (GTTNQ)
Dynatrace, Inc. (DXC)
Dynatrace, Inc. (DOX)
|
|
Industry / Sector / Ticker Info
Analyst Coverage: No
Industry Group: IT Services
Sector: Computer and Technology
CUSIP: 268150109
SIC: 7372
|
|
Fiscal Year
Fiscal Year End: March
Last Reported Quarter: 12/01/25
Next Expected EPS Date: 05/13/26
|
|
Share - Related Items
Shares Outstanding: 298.25
Most Recent Split Date: (:1)
Beta: 0.82
Market Capitalization: $12,001.62 (millions)
|
|
|
|
|
| |
| • EPS Information |
• Dividend Information |
| Analyst Coverage: No |
Dividend Yield: 0.00% |
| Current Fiscal Quarter EPS Consensus Estimate: $0.20 |
Indicated Annual Dividend: $0.00 |
| Current Fiscal Year EPS Consensus Estimate: $0.89 |
Payout Ratio: 0.00 |
| Number of Estimates in the Fiscal Year Consensus: 11.00 |
Change In Payout Ratio: 0.00 |
| Estmated Long-Term EPS Growth Rate: 14.19% |
Last Dividend Paid: NA - $0.00 |
| Next EPS Report Date: 05/13/26 |
|
|
|
| |