| Zacks Company Profile for Eventbrite, Inc. (EB : NYSE) |
|
|
| |
| • Company Description |
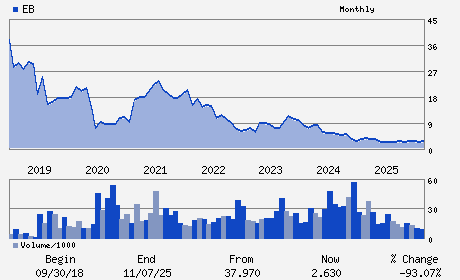
| Eventbrite, Inc. offers a platform which allows users to provide online event planning services, as well as publishes, promotes and sells tickets through social networks and e-mails. Eventbrite, Inc. is based in San Francisco, United States.
Number of Employees: 748 |
|
|
| |
| • Price / Volume Information |
| Yesterday's Closing Price: $4.42 |
Daily Weekly Monthly
 |
| 20 Day Moving Average: 1,143,611 shares |
| Shares Outstanding: 97.68 (millions) |
| Market Capitalization: $431.72 (millions) |
| Beta: 1.37 |
| 52 Week High: $4.48 |
| 52 Week Low: $1.81 |
| Short Interest Ratio: |
| |
% Price Change |
% Price Change Relative to S&P 500 |
| 4 Week |
0.00% |
0.87% |
| 12 Week |
-0.23% |
-0.35% |
| Year To Date |
-0.67% |
-1.16% |
|
|
|
|
| |
|
|
| |
| • General Corporate Information |
Officers
Julia Hartz - Chief Executive Officer and Executive Chair
Anand Gandhi - Chief Financial Officer
Katherine August-deWilde - Director
Jane Lauder - Director
Pilar Manchon - Director
|
|
Peer Information
Eventbrite, Inc. (BIZZ)
Eventbrite, Inc. (DCLK)
Eventbrite, Inc. (DGIN.)
Eventbrite, Inc. (DVW)
Eventbrite, Inc. (CYCHZ)
Eventbrite, Inc. (IFXC)
|
|
Industry / Sector / Ticker Info
Analyst Coverage: No
Industry Group: INTERNET SERVICES
Sector: Computer and Technology
CUSIP: 29975E109
SIC: 7370
|
|
Fiscal Year
Fiscal Year End: December
Last Reported Quarter: 09/01/25
Next Expected EPS Date: 02/26/26
|
|
Share - Related Items
Shares Outstanding: 97.68
Most Recent Split Date: (:1)
Beta: 1.37
Market Capitalization: $431.72 (millions)
|
|
|
|
|
| |
| • EPS Information |
• Dividend Information |
| Analyst Coverage: No |
Dividend Yield: 0.00% |
| Current Fiscal Quarter EPS Consensus Estimate: $-0.03 |
Indicated Annual Dividend: $0.00 |
| Current Fiscal Year EPS Consensus Estimate: $-0.05 |
Payout Ratio: |
| Number of Estimates in the Fiscal Year Consensus: 2.00 |
Change In Payout Ratio: |
| Estmated Long-Term EPS Growth Rate: % |
Last Dividend Paid: NA - $0.00 |
| Next EPS Report Date: 02/26/26 |
|
|
|
| |