| Zacks Company Profile for Ennis, Inc. (EBF : NYSE) |
|
|
| |
| • Company Description |
| Ennis, Inc. is one of the largest private-label printed business product suppliers in the United States. Ennis offers an extensive product line from simple to complex forms, laser cut-sheets, negotiable documents, internal bank forms, tags, labels, presentation folders, commercial printing, advertising specialties, screen printed products, and point-of-purchase display advertising that can be custom designed to customer needs.
Number of Employees: 1,856 |
|
|
| |
| • Price / Volume Information |
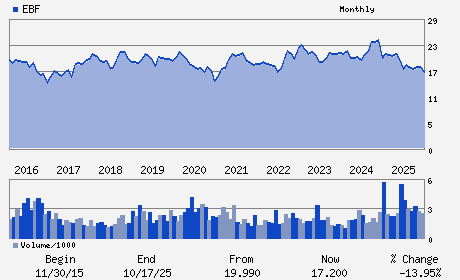
| Yesterday's Closing Price: $20.44 |
Daily Weekly Monthly
 |
| 20 Day Moving Average: 159,267 shares |
| Shares Outstanding: 25.29 (millions) |
| Market Capitalization: $516.99 (millions) |
| Beta: 0.35 |
| 52 Week High: $21.60 |
| 52 Week Low: $16.30 |
| Short Interest Ratio: |
| |
% Price Change |
% Price Change Relative to S&P 500 |
| 4 Week |
-1.30% |
2.52% |
| 12 Week |
12.74% |
17.97% |
| Year To Date |
13.49% |
17.27% |
|
|
|
|
| |
| • Address & Contact Information |
| Street Address |
Phone / Fax |
Email Address |
Web URL |
2441 PRESIDENTIAL PARKWAY
-
MIDLOTHIAN,TX 76065
USA |
ph: 972-775-9801
fax: 800-645-8339 |
investor@ennis.com |
http://www.ennis.com |
|
|
| |
| • General Corporate Information |
Officers
Keith S. Walters - Chief Executive Office;Chairman and President
Vera Burnett - Chief Financial Officer; Treasurer
Aaron Carter - Director
John R. Blind - Director
Michael J. Schaefer - Director
|
|
Peer Information
Ennis, Inc. (CIX)
Ennis, Inc. (T.SXP)
Ennis, Inc. (DXT)
Ennis, Inc. (CIIG.)
Ennis, Inc. (DAYR)
Ennis, Inc. (GGIT)
|
|
Industry / Sector / Ticker Info
Analyst Coverage: No
Industry Group: OFFICE SPPL&FRM
Sector: Industrial Products
CUSIP: 293389102
SIC: 2761
|
|
Fiscal Year
Fiscal Year End: February
Last Reported Quarter: 11/01/25
Next Expected EPS Date: 04/20/26
|
|
Share - Related Items
Shares Outstanding: 25.29
Most Recent Split Date: 8.00 (1.50:1)
Beta: 0.35
Market Capitalization: $516.99 (millions)
|
|
|
|
|
| |
| • EPS Information |
• Dividend Information |
| Analyst Coverage: No |
Dividend Yield: 4.89% |
| Current Fiscal Quarter EPS Consensus Estimate: $ |
Indicated Annual Dividend: $1.00 |
| Current Fiscal Year EPS Consensus Estimate: $ |
Payout Ratio: 0.60 |
| Number of Estimates in the Fiscal Year Consensus: |
Change In Payout Ratio: -0.09 |
| Estmated Long-Term EPS Growth Rate: % |
Last Dividend Paid: 01/08/2026 - $0.25 |
| Next EPS Report Date: 04/20/26 |
|
|
|
| |