| Zacks Company Profile for ECARX Holdings, Inc. (ECX : NSDQ) |
|
|
| |
| • Company Description |
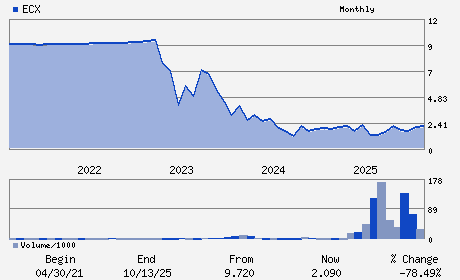
| ECARX Holdings Inc. is a mobility tech company. Its current core products include infotainment head units, digital cockpits, vehicle chip-set solutions, a core operating system and integrated software stack. ECARX Holdings Inc., formerly known as COVA Acquisition Corp., is based in LONDON.
Number of Employees: 1,918 |
|
|
| |
| • Price / Volume Information |
| Yesterday's Closing Price: $1.15 |
Daily Weekly Monthly
 |
| 20 Day Moving Average: 5,646,317 shares |
| Shares Outstanding: 370.73 (millions) |
| Market Capitalization: $426.34 (millions) |
| Beta: 0.77 |
| 52 Week High: $3.07 |
| 52 Week Low: $0.76 |
| Short Interest Ratio: |
| |
% Price Change |
% Price Change Relative to S&P 500 |
| 4 Week |
-35.03% |
-33.47% |
| 12 Week |
-36.11% |
-35.13% |
| Year To Date |
-33.14% |
-31.41% |
|
|
|
|
| |
| • Address & Contact Information |
| Street Address |
Phone / Fax |
Email Address |
Web URL |
12/F Tower 2 Park Place 88 Baise Road Xuhui District
-
Shanghai,F4 200231
CHN |
ph: 86-571-8530-6757
fax: - |
ir@ecarxgroup.com |
http://www.ecarxgroup.com |
|
|
| |
| • General Corporate Information |
Officers
Ziyu Shen - Chairman and Chief Executive Officer
Peter Cirino - Chief Operating Officer
Jing Phil Zhou - Chief Financial Officer
Zenggang Liu - Director
Ni Li - Director
|
|
Peer Information
ECARX Holdings, Inc. (EVOL)
ECARX Holdings, Inc. (RAMP)
ECARX Holdings, Inc. (LGTY)
ECARX Holdings, Inc. (ALOT)
ECARX Holdings, Inc. (CXT)
ECARX Holdings, Inc. (TGHI)
|
|
Industry / Sector / Ticker Info
Analyst Coverage: No
Industry Group: Technology Services
Sector: Business Services
CUSIP: G29201103
SIC: 7373
|
|
Fiscal Year
Fiscal Year End: December
Last Reported Quarter: 12/01/25
Next Expected EPS Date: 04/29/26
|
|
Share - Related Items
Shares Outstanding: 370.73
Most Recent Split Date: (:1)
Beta: 0.77
Market Capitalization: $426.34 (millions)
|
|
|
|
|
| |
| • EPS Information |
• Dividend Information |
| Analyst Coverage: No |
Dividend Yield: 0.00% |
| Current Fiscal Quarter EPS Consensus Estimate: $ |
Indicated Annual Dividend: $0.00 |
| Current Fiscal Year EPS Consensus Estimate: $-0.04 |
Payout Ratio: |
| Number of Estimates in the Fiscal Year Consensus: 1.00 |
Change In Payout Ratio: |
| Estmated Long-Term EPS Growth Rate: % |
Last Dividend Paid: NA - $0.00 |
| Next EPS Report Date: 04/29/26 |
|
|
|
| |