| Zacks Company Profile for New Oriental Education & Technology Group, Inc. (EDU : NYSE) |
|
|
| |
| • Company Description |
| New Oriental is the largest provider of private educational services in China based on the number of program offerings, total student enrollments and geographic presence. New Oriental offers a wide range of educational programs, services and products consisting primarily of English and other foreign language training, test preparation courses for major admissions and assessment tests in the United States, the PRC and Commonwealth countries, primary and secondary school education, development and distribution of educational content, software and other technology, and online education. New Oriental's ADSs, each of which represents four common shares, currently trade on the New York Stock Exchange under the symbol ''EDU.''
Number of Employees: 84,111 |
|
|
| |
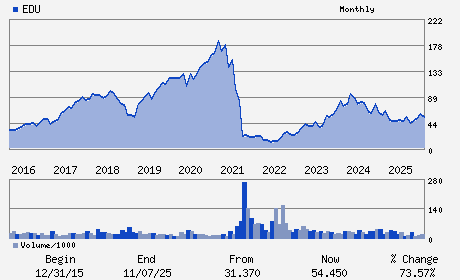
| • Price / Volume Information |
| Yesterday's Closing Price: $46.26 |
Daily Weekly Monthly
 |
| 20 Day Moving Average: 669,385 shares |
| Shares Outstanding: 158.03 (millions) |
| Market Capitalization: $7,310.42 (millions) |
| Beta: 0.24 |
| 52 Week High: $64.97 |
| 52 Week Low: $41.62 |
| Short Interest Ratio: |
| |
% Price Change |
% Price Change Relative to S&P 500 |
| 4 Week |
-15.41% |
-19.38% |
| 12 Week |
-13.23% |
-21.63% |
| Year To Date |
-15.94% |
-23.92% |
|
|
|
|
| |
| • Address & Contact Information |
| Street Address |
Phone / Fax |
Email Address |
Web URL |
NO. 6 HAI DIAN ZHONG STREET 9TH FLOOR
-
BEIJING,F4 100080
CHN |
ph: 86-10-6090-8000
fax: 86-10-6260-5511 |
zhaosisi@xdf.cn |
http://www.neworiental.org |
|
|
| |
| • General Corporate Information |
Officers
Chenggang Zhou - Chief Executive Officer
Michael Minhong Yu - Executive Chairman
Zhihui Yang - Executive President and Chief Financial Officer
Louis T. Hsieh - Director
Robin Yanhong Li - Director
|
|
Peer Information
New Oriental Education & Technology Group, Inc. (BFAM.)
New Oriental Education & Technology Group, Inc. (NLCI)
New Oriental Education & Technology Group, Inc. (CVSA)
New Oriental Education & Technology Group, Inc. (ITCC.)
New Oriental Education & Technology Group, Inc. (LCGI)
New Oriental Education & Technology Group, Inc. (APOL)
|
|
Industry / Sector / Ticker Info
Analyst Coverage: No
Industry Group: SCHOOLS
Sector: Consumer Discretionary
CUSIP: 647581206
SIC: 8200
|
|
Fiscal Year
Fiscal Year End: May
Last Reported Quarter: 02/01/26
Next Expected EPS Date: 07/29/26
|
|
Share - Related Items
Shares Outstanding: 158.03
Most Recent Split Date: 4.00 (0.10:1)
Beta: 0.24
Market Capitalization: $7,310.42 (millions)
|
|
|
|
|
| |
| • EPS Information |
• Dividend Information |
| Analyst Coverage: No |
Dividend Yield: 2.51% |
| Current Fiscal Quarter EPS Consensus Estimate: $0.43 |
Indicated Annual Dividend: $1.16 |
| Current Fiscal Year EPS Consensus Estimate: $3.19 |
Payout Ratio: 0.19 |
| Number of Estimates in the Fiscal Year Consensus: 4.00 |
Change In Payout Ratio: 0.16 |
| Estmated Long-Term EPS Growth Rate: 18.62% |
Last Dividend Paid: 05/15/2026 - $0.58 |
| Next EPS Report Date: 07/29/26 |
|
|
|
| |