| Zacks Company Profile for Emmaus Life Sciences, Inc. (EMMA : OTC) |
|
|
| |
| • Company Description |
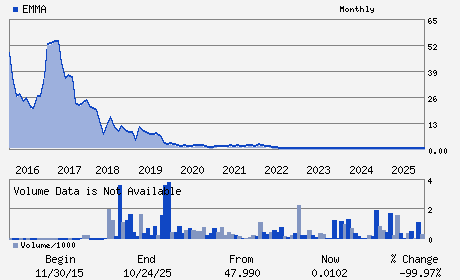
| Emmaus Life Sciences Inc. is a commercial-stage biopharmaceutical company. It is engaged in the discovery, development, marketing and sale of treatments and therapies, for rare and orphan disease categories. Emmaus Life Sciences Inc., formerly known MYnd Analytics Inc., is based in Torrance, United States.
Number of Employees: 35 |
|
|
| |
| • Price / Volume Information |
| Yesterday's Closing Price: $0.01 |
Daily Weekly Monthly
 |
| 20 Day Moving Average: 3,585 shares |
| Shares Outstanding: 70.19 (millions) |
| Market Capitalization: $1.05 (millions) |
| Beta: 9.85 |
| 52 Week High: $0.03 |
| 52 Week Low: $0.01 |
| Short Interest Ratio: |
| |
% Price Change |
% Price Change Relative to S&P 500 |
| 4 Week |
7.14% |
12.90% |
| 12 Week |
15.39% |
19.82% |
| Year To Date |
15.39% |
19.82% |
|
|
|
|
| |
|
|
| |
| • General Corporate Information |
Officers
Willis C. Lee - Chairman of the Board; Chief Executive Officer
Yasushi Nagasaki - Chief Financial Officer
Charles Stark - Chief Science Officer
Wei Peu Zen - Director
Ian Zwicker - Director
|
|
Peer Information
Emmaus Life Sciences, Inc. (CORR.)
Emmaus Life Sciences, Inc. (RSPI)
Emmaus Life Sciences, Inc. (CGXP)
Emmaus Life Sciences, Inc. (BGEN)
Emmaus Life Sciences, Inc. (GTBP)
Emmaus Life Sciences, Inc. (RGRX)
|
|
Industry / Sector / Ticker Info
Analyst Coverage: No
Industry Group: MED-BIOMED/GENE
Sector: Medical
CUSIP: 29137T101
SIC: 2834
|
|
Fiscal Year
Fiscal Year End: December
Last Reported Quarter: 09/01/25
Next Expected EPS Date: 04/13/26
|
|
Share - Related Items
Shares Outstanding: 70.19
Most Recent Split Date: 7.00 (0.17:1)
Beta: 9.85
Market Capitalization: $1.05 (millions)
|
|
|
|
|
| |
| • EPS Information |
• Dividend Information |
| Analyst Coverage: No |
Dividend Yield: 0.00% |
| Current Fiscal Quarter EPS Consensus Estimate: $ |
Indicated Annual Dividend: $0.00 |
| Current Fiscal Year EPS Consensus Estimate: $ |
Payout Ratio: |
| Number of Estimates in the Fiscal Year Consensus: |
Change In Payout Ratio: |
| Estmated Long-Term EPS Growth Rate: % |
Last Dividend Paid: NA - $0.00 |
| Next EPS Report Date: 04/13/26 |
|
|
|
| |