| Zacks Company Profile for Eton Pharmaceuticals, Inc. (ETON : NSDQ) |
|
|
| |
| • Company Description |
| Eton Pharmaceuticals Inc. operates as a development stage biotechnology company. Its product pipeline consists of DS-300, EM-100, DS-100, DS-200, ET-103, ET-101, ET-102 and CT-100 which are in clinical stage. Eton Pharmaceuticals Inc. is based in Deer Park, Illinois.
Number of Employees: 31 |
|
|
| |
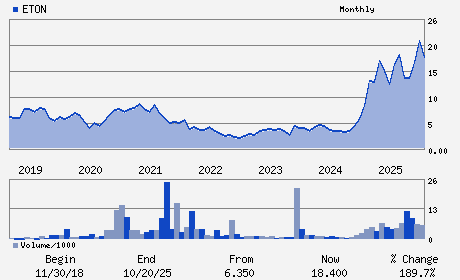
| • Price / Volume Information |
| Yesterday's Closing Price: $20.77 |
Daily Weekly Monthly
 |
| 20 Day Moving Average: 349,137 shares |
| Shares Outstanding: 26.82 (millions) |
| Market Capitalization: $557.00 (millions) |
| Beta: 1.19 |
| 52 Week High: $23.00 |
| 52 Week Low: $11.09 |
| Short Interest Ratio: |
| |
% Price Change |
% Price Change Relative to S&P 500 |
| 4 Week |
14.00% |
18.40% |
| 12 Week |
22.25% |
28.27% |
| Year To Date |
22.83% |
27.27% |
|
|
|
|
| |
|
|
| |
| • General Corporate Information |
Officers
Sean E. Brynjelsen - Chief Executive Officer;President and Director
James Gruber - Chief Financial Officer; Treasurer and Secretary
Jennifer M. Adams - Director
Charles J. Casamento - Director
Paul V. Maier - Director
|
|
Peer Information
Eton Pharmaceuticals, Inc. (CORR.)
Eton Pharmaceuticals, Inc. (RSPI)
Eton Pharmaceuticals, Inc. (CGXP)
Eton Pharmaceuticals, Inc. (BGEN)
Eton Pharmaceuticals, Inc. (GTBP)
Eton Pharmaceuticals, Inc. (RGRX)
|
|
Industry / Sector / Ticker Info
Analyst Coverage: No
Industry Group: MED-BIOMED/GENE
Sector: Medical
CUSIP: 29772L108
SIC: 2834
|
|
Fiscal Year
Fiscal Year End: December
Last Reported Quarter: 12/01/25
Next Expected EPS Date: 05/12/26
|
|
Share - Related Items
Shares Outstanding: 26.82
Most Recent Split Date: (:1)
Beta: 1.19
Market Capitalization: $557.00 (millions)
|
|
|
|
|
| |
| • EPS Information |
• Dividend Information |
| Analyst Coverage: No |
Dividend Yield: 0.00% |
| Current Fiscal Quarter EPS Consensus Estimate: $0.20 |
Indicated Annual Dividend: $0.00 |
| Current Fiscal Year EPS Consensus Estimate: $1.02 |
Payout Ratio: |
| Number of Estimates in the Fiscal Year Consensus: 2.00 |
Change In Payout Ratio: |
| Estmated Long-Term EPS Growth Rate: % |
Last Dividend Paid: NA - $0.00 |
| Next EPS Report Date: 05/12/26 |
|
|
|
| |