| Zacks Company Profile for Evolent Health, Inc (EVH : NYSE) |
|
|
| |
| • Company Description |
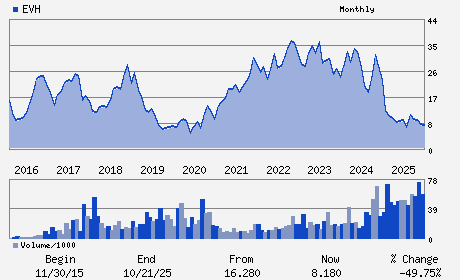
| Evolent Health, Inc. is involved in the healthcare delivery and payment markets. The company provides technology-enabled services platform for providers to transition their organization in value-based payment models. Evolent Health, Inc. is based in Arlington, Virginia.
Number of Employees: 4,200 |
|
|
| |
| • Price / Volume Information |
| Yesterday's Closing Price: $2.49 |
Daily Weekly Monthly
 |
| 20 Day Moving Average: 3,777,083 shares |
| Shares Outstanding: 111.64 (millions) |
| Market Capitalization: $277.98 (millions) |
| Beta: 0.24 |
| 52 Week High: $12.07 |
| 52 Week Low: $2.38 |
| Short Interest Ratio: |
| |
% Price Change |
% Price Change Relative to S&P 500 |
| 4 Week |
-10.11% |
-6.60% |
| 12 Week |
-38.82% |
-35.80% |
| Year To Date |
-37.75% |
-35.25% |
|
|
|
|
| |
|
|
| |
| • General Corporate Information |
Officers
Seth Blackley - Chief Executive Officer
Mario Ramos - Chief Financial Officer
Aammaad Shams - Chief Accounting Officer
Craig Barbarosh - Director
Peter Grua - Director
|
|
Peer Information
Evolent Health, Inc (HLIS)
Evolent Health, Inc (AZTA)
Evolent Health, Inc (APYI)
Evolent Health, Inc (RNVA)
Evolent Health, Inc (HMSY)
Evolent Health, Inc (LRSI)
|
|
Industry / Sector / Ticker Info
Analyst Coverage: No
Industry Group: MEDICAL INFO SYS
Sector: Medical
CUSIP: 30050B101
SIC: 8741
|
|
Fiscal Year
Fiscal Year End: December
Last Reported Quarter: 12/01/25
Next Expected EPS Date: 05/14/26
|
|
Share - Related Items
Shares Outstanding: 111.64
Most Recent Split Date: (:1)
Beta: 0.24
Market Capitalization: $277.98 (millions)
|
|
|
|
|
| |
| • EPS Information |
• Dividend Information |
| Analyst Coverage: No |
Dividend Yield: 0.00% |
| Current Fiscal Quarter EPS Consensus Estimate: $-0.02 |
Indicated Annual Dividend: $0.00 |
| Current Fiscal Year EPS Consensus Estimate: $0.00 |
Payout Ratio: |
| Number of Estimates in the Fiscal Year Consensus: 4.00 |
Change In Payout Ratio: |
| Estmated Long-Term EPS Growth Rate: % |
Last Dividend Paid: NA - $0.00 |
| Next EPS Report Date: 05/14/26 |
|
|
|
| |