| Zacks Company Profile for Evolv Technologies Holdings, Inc. (EVLV : NSDQ) |
|
|
| |
| • Company Description |
| Evolv Technologies Holdings Inc. provides weapons detection security screening systems. The company offer an array of AI touchless screening technologies for weapons detection, identity verification and health-related threats through Evolv Cortex AI(TM) software platform. Evolv Technologies Holdings Inc., formerly known as NewHold Investment Corp., is based in NEW YORK.
Number of Employees: 286 |
|
|
| |
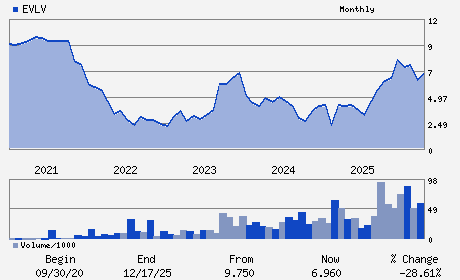
| • Price / Volume Information |
| Yesterday's Closing Price: $5.70 |
Daily Weekly Monthly
 |
| 20 Day Moving Average: 3,249,399 shares |
| Shares Outstanding: 179.87 (millions) |
| Market Capitalization: $1,025.26 (millions) |
| Beta: 1.82 |
| 52 Week High: $8.91 |
| 52 Week Low: $4.69 |
| Short Interest Ratio: |
| |
% Price Change |
% Price Change Relative to S&P 500 |
| 4 Week |
-11.76% |
-16.14% |
| 12 Week |
4.97% |
-2.77% |
| Year To Date |
-20.39% |
-26.97% |
|
|
|
|
| |
|
|
| |
| • General Corporate Information |
Officers
John Kedzierski - President and Chief Executive Officer
Neil Glat - Chairman
George C. Kutsor - Chief Financial Officer
Kevin Charlton - Director
Michael Ellenbogen - Director
|
|
Peer Information
Evolv Technologies Holdings, Inc. (UIS)
Evolv Technologies Holdings, Inc. (CTSH)
Evolv Technologies Holdings, Inc. (GTTNQ)
Evolv Technologies Holdings, Inc. (DXC)
Evolv Technologies Holdings, Inc. (DOX)
Evolv Technologies Holdings, Inc. (RENX1)
|
|
Industry / Sector / Ticker Info
Analyst Coverage: No
Industry Group: IT Services
Sector: Computer and Technology
CUSIP: 30049H102
SIC: 3577
|
|
Fiscal Year
Fiscal Year End: December
Last Reported Quarter: 03/01/26
Next Expected EPS Date: 08/13/26
|
|
Share - Related Items
Shares Outstanding: 179.87
Most Recent Split Date: (:1)
Beta: 1.82
Market Capitalization: $1,025.26 (millions)
|
|
|
|
|
| |
| • EPS Information |
• Dividend Information |
| Analyst Coverage: No |
Dividend Yield: 0.00% |
| Current Fiscal Quarter EPS Consensus Estimate: $-0.05 |
Indicated Annual Dividend: $0.00 |
| Current Fiscal Year EPS Consensus Estimate: $-0.18 |
Payout Ratio: |
| Number of Estimates in the Fiscal Year Consensus: 1.00 |
Change In Payout Ratio: |
| Estmated Long-Term EPS Growth Rate: % |
Last Dividend Paid: NA - $0.00 |
| Next EPS Report Date: 08/13/26 |
|
|
|
| |