| Zacks Company Profile for Farmmi, Inc. (FAMI : NSDQ) |
|
|
| |
| • Company Description |
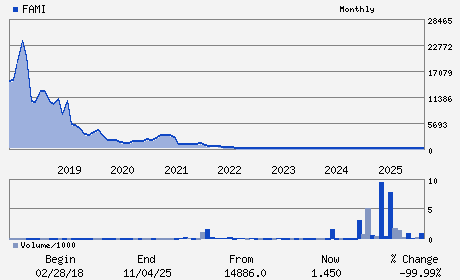
| Farmmi Inc. is an agricultural products supplier. The company processes and sells Shiitake mushrooms, Mu Er mushrooms, edible fungi and other agricultural products. In addition, the Company's ecommerce platform Farmmi Liangpin Market, provides consumers access to locally sourced agricultural products. Farmmi Inc. is based in Lishui, Zhejiang, China.
Number of Employees: 15 |
|
|
| |
| • Price / Volume Information |
| Yesterday's Closing Price: $1.33 |
Daily Weekly Monthly
 |
| 20 Day Moving Average: 8,131 shares |
| Shares Outstanding: 5.48 (millions) |
| Market Capitalization: $7.29 (millions) |
| Beta: 1.67 |
| 52 Week High: $3.44 |
| 52 Week Low: $1.11 |
| Short Interest Ratio: |
| |
% Price Change |
% Price Change Relative to S&P 500 |
| 4 Week |
-5.00% |
-4.17% |
| 12 Week |
-11.33% |
-11.44% |
| Year To Date |
4.72% |
4.22% |
|
|
|
|
| |
| • Address & Contact Information |
| Street Address |
Phone / Fax |
Email Address |
Web URL |
FL 1 BUILDING NO. 1 888 TIANNING STREET LIANDU DISTRICT
-
LISHUI,F4 323000
CHN |
ph: 8605-78-8261-2876
fax: - |
ir@farmmi.com |
https://farmmi.com |
|
|
| |
| • General Corporate Information |
Officers
Yefang Zhang - Chief Executive Officer
Zhimin Lu - Chief Financial Officer
Chenyang Wang - Director
Qinyi Fu - Director
Hongdao Qian - Director
|
|
Peer Information
Farmmi, Inc. (DLP)
Farmmi, Inc. (CPKPY)
Farmmi, Inc. (ABTXQ)
Farmmi, Inc. (ADM)
Farmmi, Inc. (CRESY)
Farmmi, Inc. (PYYX)
|
|
Industry / Sector / Ticker Info
Analyst Coverage: No
Industry Group: AGRI OPERATIONS
Sector: Consumer Staples
CUSIP: G33277149
SIC: 2033
|
|
Fiscal Year
Fiscal Year End: September
Last Reported Quarter: -
Next Expected EPS Date: 05/12/26
|
|
Share - Related Items
Shares Outstanding: 5.48
Most Recent Split Date: 3.00 (0.08:1)
Beta: 1.67
Market Capitalization: $7.29 (millions)
|
|
|
|
|
| |
| • EPS Information |
• Dividend Information |
| Analyst Coverage: No |
Dividend Yield: 0.00% |
| Current Fiscal Quarter EPS Consensus Estimate: $ |
Indicated Annual Dividend: $0.00 |
| Current Fiscal Year EPS Consensus Estimate: $ |
Payout Ratio: |
| Number of Estimates in the Fiscal Year Consensus: |
Change In Payout Ratio: |
| Estmated Long-Term EPS Growth Rate: % |
Last Dividend Paid: NA - $0.00 |
| Next EPS Report Date: 05/12/26 |
|
|
|
| |