| Zacks Company Profile for Diamondback Energy, Inc. (FANG : NSDQ) |
|
|
| |
| • Company Description |
| Diamondback Energy, Inc. is an independent oil and gas exploration & production company, with its primary focus on the Permian Basin. The upstream operator focuses on growth through a combination of acquisitions and active drilling in America's hottest and lowest-cost shale region. The Permian `Super' BasinA sedimentary basin lying underneath the western part of Texas and the south-eastern part of New Mexico.
Number of Employees: 1,762 |
|
|
| |
| • Price / Volume Information |
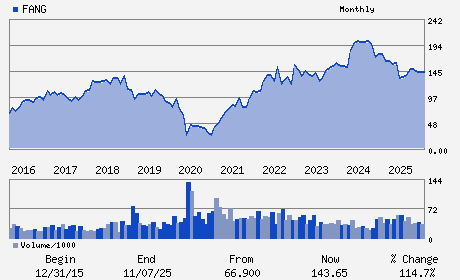
| Yesterday's Closing Price: $196.94 |
Daily Weekly Monthly
 |
| 20 Day Moving Average: 2,672,154 shares |
| Shares Outstanding: 280.02 (millions) |
| Market Capitalization: $55,148.00 (millions) |
| Beta: 0.43 |
| 52 Week High: $216.90 |
| 52 Week Low: $136.13 |
| Short Interest Ratio: |
| |
% Price Change |
% Price Change Relative to S&P 500 |
| 4 Week |
-6.67% |
-6.63% |
| 12 Week |
7.88% |
3.92% |
| Year To Date |
31.00% |
17.42% |
|
|
|
|
| |
|
|
| |
| • General Corporate Information |
Officers
Kaes Van't Hof - Chief Executive Officer and Director
Travis D. Stice - Executive Chairman of the Board and Director
Jere W. Thompson III - Chief Financial Officer; Executive Vice President
Teresa L. Dick - Chief Accounting Officer; Executive Vice President
Darin G. Holderness - Director
|
|
Peer Information
Diamondback Energy, Inc. (AEGG)
Diamondback Energy, Inc. (CHAR)
Diamondback Energy, Inc. (CECX.)
Diamondback Energy, Inc. (DLOV)
Diamondback Energy, Inc. (WACC)
Diamondback Energy, Inc. (DVN)
|
|
Industry / Sector / Ticker Info
Analyst Coverage: No
Industry Group: OIL-US EXP&PROD
Sector: Oils/Energy
CUSIP: 25278X109
SIC: 1311
|
|
Fiscal Year
Fiscal Year End: December
Last Reported Quarter: 06/01/26
Next Expected EPS Date: 11/02/26
|
|
Share - Related Items
Shares Outstanding: 280.02
Most Recent Split Date: (:1)
Beta: 0.43
Market Capitalization: $55,148.00 (millions)
|
|
|
|
|
| |
| • EPS Information |
• Dividend Information |
| Analyst Coverage: No |
Dividend Yield: 2.23% |
| Current Fiscal Quarter EPS Consensus Estimate: $4.44 |
Indicated Annual Dividend: $4.40 |
| Current Fiscal Year EPS Consensus Estimate: $19.94 |
Payout Ratio: 0.28 |
| Number of Estimates in the Fiscal Year Consensus: 8.00 |
Change In Payout Ratio: 0.07 |
| Estmated Long-Term EPS Growth Rate: % |
Last Dividend Paid: 08/13/2026 - $1.10 |
| Next EPS Report Date: 11/02/26 |
|
|
|
| |

