| Zacks Company Profile for First Hawaiian, Inc. (FHB : NSDQ) |
|
|
| |
| • Company Description |
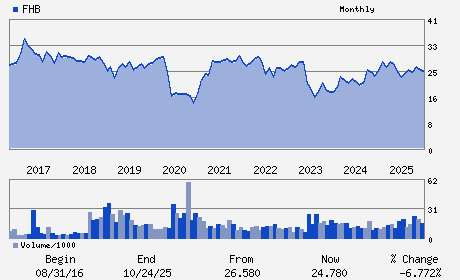
| First Hawaiian, Inc. offers banking services to consumer and commercial customers which includes deposit products, lending services and wealth management, insurance, private banking and trust services. First Hawaiian Inc. is based in San Francisco, California.
Number of Employees: 2,000 |
|
|
| |
| • Price / Volume Information |
| Yesterday's Closing Price: $27.35 |
Daily Weekly Monthly
 |
| 20 Day Moving Average: 1,402,209 shares |
| Shares Outstanding: 121.65 (millions) |
| Market Capitalization: $3,327.10 (millions) |
| Beta: 0.74 |
| 52 Week High: $28.35 |
| 52 Week Low: $22.65 |
| Short Interest Ratio: |
| |
% Price Change |
% Price Change Relative to S&P 500 |
| 4 Week |
0.04% |
0.24% |
| 12 Week |
14.20% |
2.57% |
| Year To Date |
8.10% |
0.22% |
|
|
|
|
| |
| • Address & Contact Information |
| Street Address |
Phone / Fax |
Email Address |
Web URL |
999 BISHOP STREET 29TH FLOOR
-
HONOLULU,HI 96813
USA |
ph: 808-525-7000
fax: - |
ir@fhb.com |
http://www.fhb.com |
|
|
| |
| • General Corporate Information |
Officers
Robert S. Harrison - Chairman of the Board; President and Chief Executi
James M. Moses - Vice Chairman and Chief Financial Officer
Tertia M. Freas - Director
Michael K. Fujimoto - Director
James S. Moffatt - Director
|
|
Peer Information
First Hawaiian, Inc. (CACB)
First Hawaiian, Inc. (CPF)
First Hawaiian, Inc. (FMBL)
First Hawaiian, Inc. (GRGN.)
First Hawaiian, Inc. (EVRT)
First Hawaiian, Inc. (EWBC)
|
|
Industry / Sector / Ticker Info
Analyst Coverage: No
Industry Group: BANKS-WEST
Sector: Finance
CUSIP: 32051X108
SIC: 6022
|
|
Fiscal Year
Fiscal Year End: December
Last Reported Quarter: 03/01/26
Next Expected EPS Date: 07/24/26
|
|
Share - Related Items
Shares Outstanding: 121.65
Most Recent Split Date: (:1)
Beta: 0.74
Market Capitalization: $3,327.10 (millions)
|
|
|
|
|
| |
| • EPS Information |
• Dividend Information |
| Analyst Coverage: No |
Dividend Yield: 3.80% |
| Current Fiscal Quarter EPS Consensus Estimate: $0.58 |
Indicated Annual Dividend: $1.04 |
| Current Fiscal Year EPS Consensus Estimate: $2.33 |
Payout Ratio: 0.46 |
| Number of Estimates in the Fiscal Year Consensus: 5.00 |
Change In Payout Ratio: -0.07 |
| Estmated Long-Term EPS Growth Rate: 5.83% |
Last Dividend Paid: 05/18/2026 - $0.26 |
| Next EPS Report Date: 07/24/26 |
|
|
|
| |