| Zacks Company Profile for GDS Holdings (GDS : NSDQ) |
|
|
| |
| • Company Description |
| GDS Holdings Limited provides information technology service. It offers integrated solutions, consulting, service and training including data center hosting, IT management and operation outsourcing, business continuity management, disaster recovery and cloud computing services. The company operates primarily in Shanghai, Beijing, Shenzhen, Guangzhou and Chengdu. GDS Holdings Limited is headquartered in Shanghai, the People's Republic of China.
Number of Employees: 2,276 |
|
|
| |
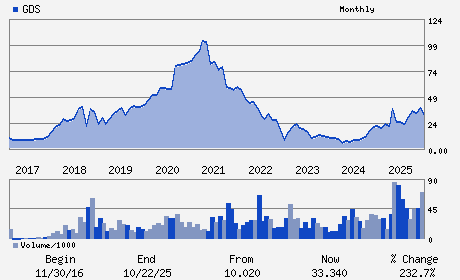
| • Price / Volume Information |
| Yesterday's Closing Price: $41.38 |
Daily Weekly Monthly
 |
| 20 Day Moving Average: 2,317,196 shares |
| Shares Outstanding: 194.40 (millions) |
| Market Capitalization: $8,044.17 (millions) |
| Beta: 0.39 |
| 52 Week High: $48.61 |
| 52 Week Low: $16.93 |
| Short Interest Ratio: |
| |
% Price Change |
% Price Change Relative to S&P 500 |
| 4 Week |
-8.21% |
-2.52% |
| 12 Week |
16.89% |
24.50% |
| Year To Date |
18.57% |
24.75% |
|
|
|
|
| |
| • Address & Contact Information |
| Street Address |
Phone / Fax |
Email Address |
Web URL |
F4/F5 BUILDING C SUNLAND INTERNATIONAL NO. 999 ZHOUHAI ROAD PUDONG
-
SHANGHAI,F4 200137
CHN |
ph: 86-21-2029-2200
fax: 86-21-2033-0202 |
ir@gds-services.com |
http://www.gds-services.com |
|
|
| |
| • General Corporate Information |
Officers
William Wei Huang - Chairman and Chief Executive Officer
Sio Tat Hiang - Vice-Chairman
Daniel Newman - Chief Financial Officer
Satoshi Okada - Director
Bruno Lopez - Director
|
|
Peer Information
GDS Holdings (EVOL)
GDS Holdings (RAMP)
GDS Holdings (LGTY)
GDS Holdings (ALOT)
GDS Holdings (CXT)
GDS Holdings (TGHI)
|
|
Industry / Sector / Ticker Info
Analyst Coverage: No
Industry Group: Technology Services
Sector: Business Services
CUSIP: 36165L108
SIC: 7370
|
|
Fiscal Year
Fiscal Year End: December
Last Reported Quarter: 12/01/25
Next Expected EPS Date: 05/19/26
|
|
Share - Related Items
Shares Outstanding: 194.40
Most Recent Split Date: (:1)
Beta: 0.39
Market Capitalization: $8,044.17 (millions)
|
|
|
|
|
| |
| • EPS Information |
• Dividend Information |
| Analyst Coverage: No |
Dividend Yield: 0.00% |
| Current Fiscal Quarter EPS Consensus Estimate: $1.06 |
Indicated Annual Dividend: $0.00 |
| Current Fiscal Year EPS Consensus Estimate: $1.16 |
Payout Ratio: 0.00 |
| Number of Estimates in the Fiscal Year Consensus: 4.00 |
Change In Payout Ratio: |
| Estmated Long-Term EPS Growth Rate: % |
Last Dividend Paid: NA - $0.00 |
| Next EPS Report Date: 05/19/26 |
|
|
|
| |